/*
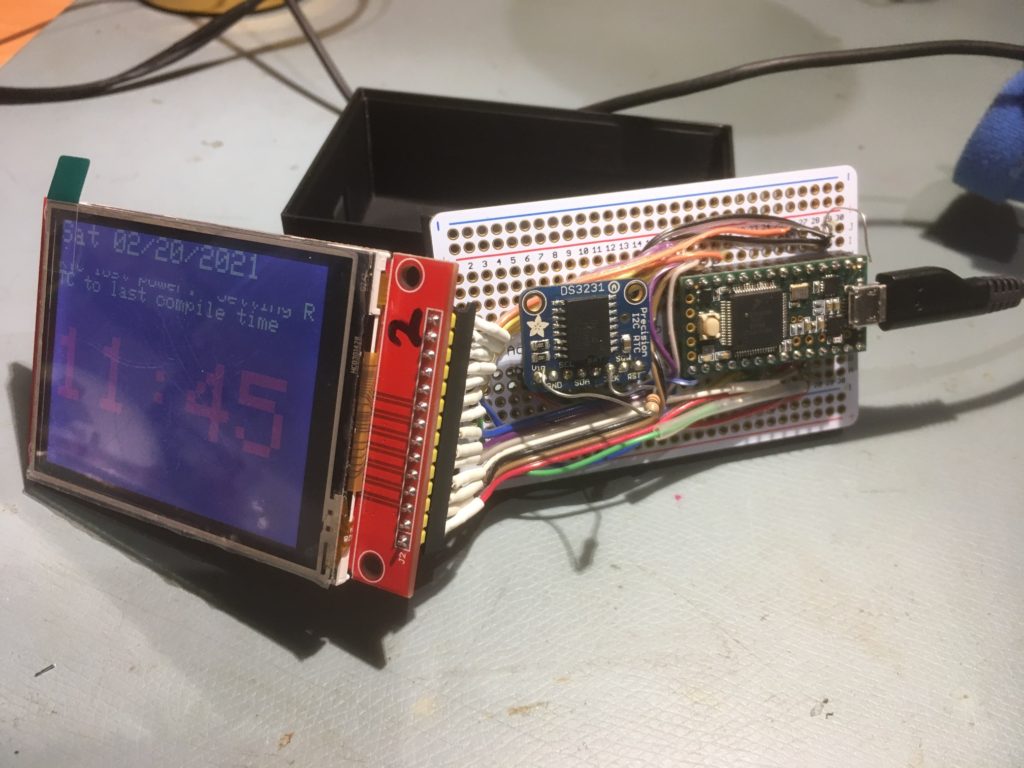
Name: Teensy_LCDClockV4.ino
Created: 3/9/2021 11:12:31 AM
Author: FRANKNEWXPS15\Frank
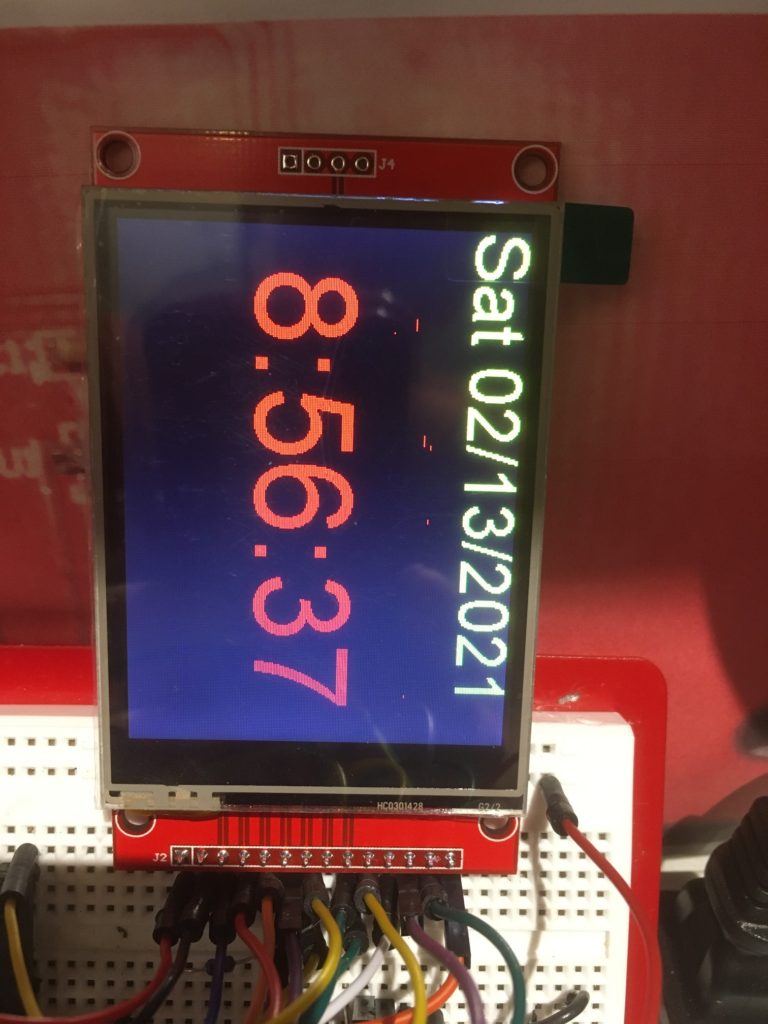
This project was cloned from Teensy_LCDClockV3 to re-investigate the use of proportional fonts
*/
#include <XPT2046_Touchscreen.h>
#include <ILI9341_t3n.h>
#include <Wire.h>
#include "RTClib.h"
#include "elapsedMillis.h"
#include "CustomBox.h"
#include "ili9341_t3n_font_Arial.h"
#define N0_DIAGNOSTICS
//****************************************************************************
// Settings and objects
//****************************************************************************
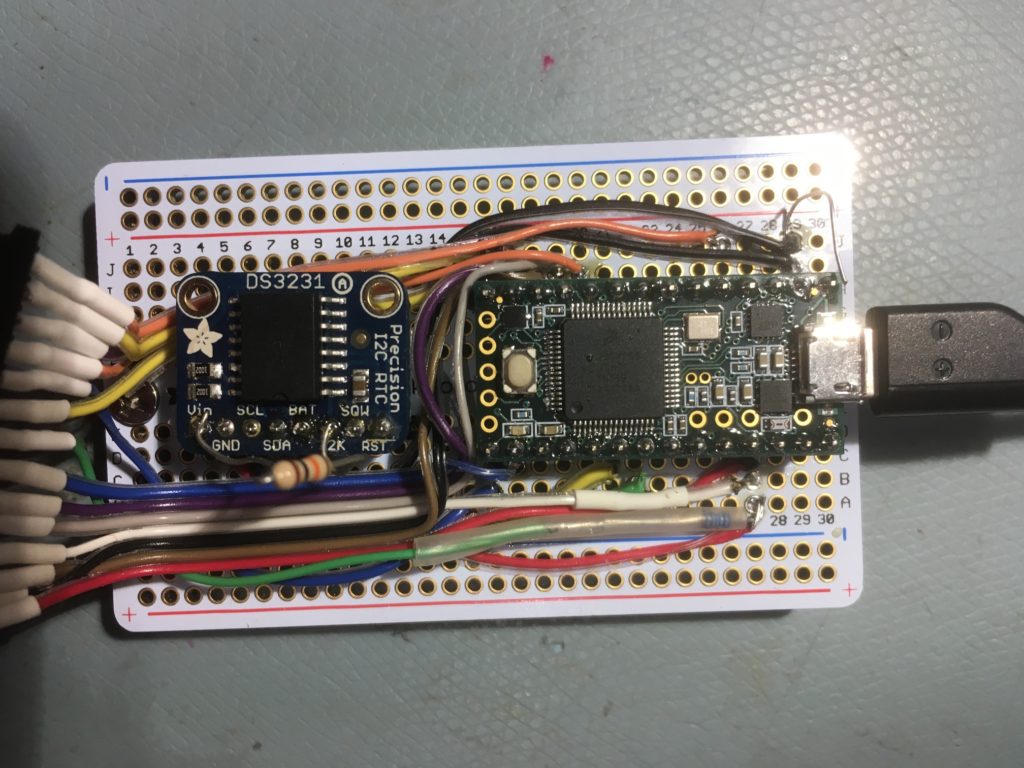
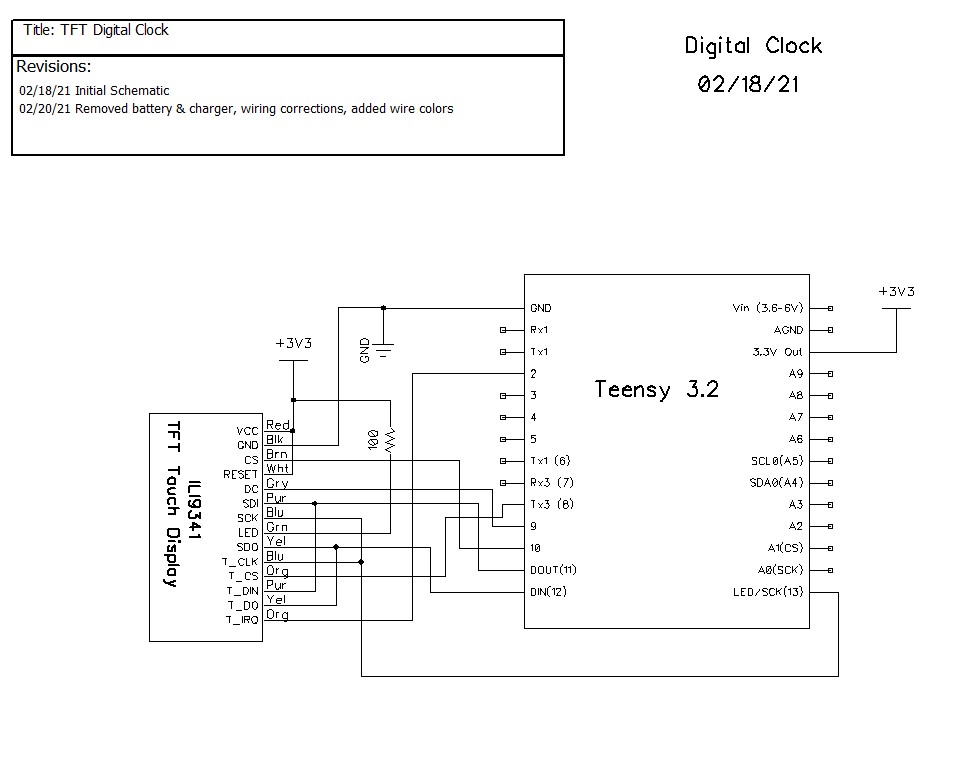
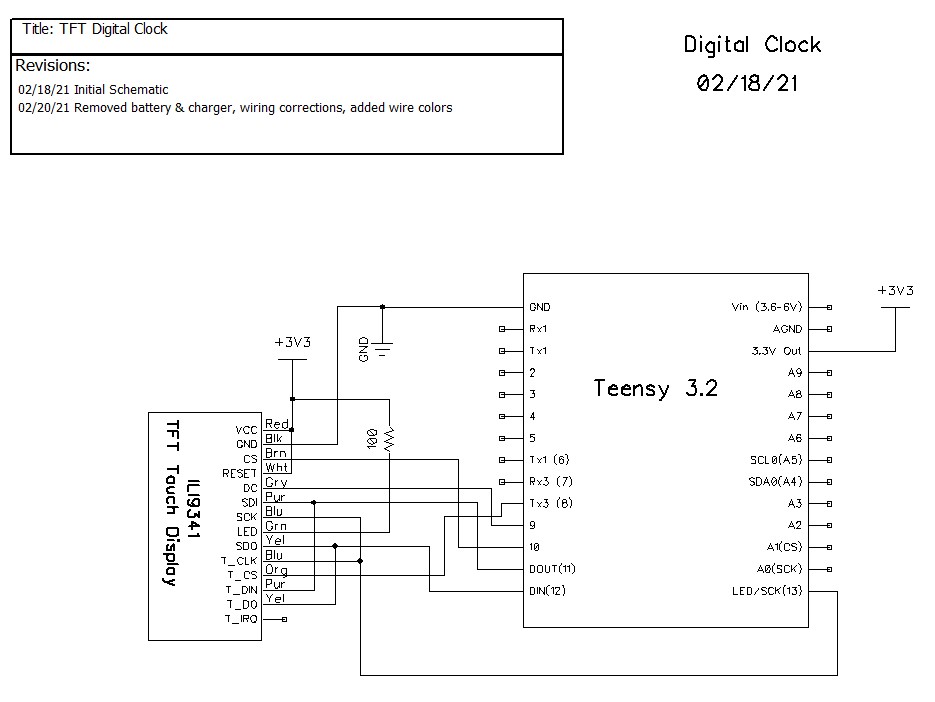
#pragma region DISPLAY_PIN_ASSIGNMENTS
//02/15/21 pin assignments from https://www.pjrc.com/store/display_ili9341_touch.html
#define TFT_DC 9
#define TFT_CS 10
#define TFT_RST 7
#define TFT_SCK 13
#define TFT_MISO 12
#define TFT_MOSI 11
#define TOUCH_CS 8
#pragma endregion DISPLAY_PIN_ASSIGNMENTS
XPT2046_Touchscreen ts(TOUCH_CS);
ILI9341_t3n tft = ILI9341_t3n(TFT_CS, TFT_DC, TFT_RST, TFT_MOSI, TFT_SCK, TFT_MISO);
elapsedMillis mSecSinceLastClockUpdate;
const int CLOCK_UPDATE_MSEC = 1000;
#pragma region DISP_AND_ADJ_BOX_PARAMETERS
// Size of the color selection boxes and the paintbrush size
#define MAX_DISPLAY_X 240
#define MAX_DISPLAY_Y 320
#define SCREEN_ORIENTATION_1
#define TS_MINX 600
#define TS_MINY 600
#define TS_MAXX 3758
#define TS_MAXY 3612
const int PLUSBOX_X = 20;
const int PLUSBOX_Y = 180;
const int PLUSBOX_WIDTH = 50;
const int PLUSBOX_HEIGHT = 50;
const int PLUSBOX_COLOR = ILI9341_BLUE;
const int MINUSBOX_X = 120;
const int MINUSBOX_Y = 180;
const int MINUSBOX_WIDTH = 50;
const int MINUSBOX_HEIGHT = 50;
const int MINUSBOX_COLOR = ILI9341_YELLOW;
const String nextstr = "NEXT";
const int nextstr_width = 70;
const int nextstr_height = 20;
const int NEXTBOX_X = 220;
const int NEXTBOX_Y = 180;
const int NEXTBOX_COLOR = ILI9341_GREEN;
const int NEXTBOX_WIDTH = 100;
const int NEXTBOX_HEIGHT = 50;
const int TIME_BOX_X = 0;
const int TIME_BOX_Y = 82;
const int TIME_BOX_WIDTH = 350;
const int TIME_BOX_HEIGHT = 80;
const int DATE_BOX_X = 0;
const int DATE_BOX_Y = 0;
const int DATE_BOX_WIDTH = 320;
const int DATE_BOX_HEIGHT = 30;
//03/05/21 used to hide adjustment boxes
const int ALL_ADJ_BOXES_WIDTH = NEXTBOX_X + NEXTBOX_WIDTH;
const int ALL_ADJ_BOXES_HEIGHT = 50;
const int TIME_HIGHLIGHT_BOX_WIDTH = 75;
const int TIME_HIGHLIGHT_BOX_HEIGHT = 5;
const int TIME_HIGHLIGHT_BOX_YLOC = 75;
const int ALL_TIME_HIGHLIGHT_BOX_WIDTH = ALL_ADJ_BOXES_WIDTH;
const int DATE_HIGHLIGHT_BOX_WIDTH = 40;
const int DATE_HIGHLIGHT_BOX_HEIGHT = 5;
const int DATE_HIGHLIGHT_BOX_YLOC = 40;
const int ALL_DATE_HIGHLIGHT_BOX_WIDTH = ALL_ADJ_BOXES_WIDTH;
CustomBox PlusBox(PLUSBOX_X, PLUSBOX_Y, PLUSBOX_WIDTH, PLUSBOX_HEIGHT, PLUSBOX_COLOR);
CustomBox MinusBox(MINUSBOX_X, MINUSBOX_Y, MINUSBOX_WIDTH, MINUSBOX_HEIGHT, MINUSBOX_COLOR);
CustomBox NextBox(NEXTBOX_X, NEXTBOX_Y, NEXTBOX_WIDTH, NEXTBOX_HEIGHT, NEXTBOX_COLOR);
CustomBox HourHighlightBox(20, TIME_HIGHLIGHT_BOX_YLOC, TIME_HIGHLIGHT_BOX_WIDTH, TIME_HIGHLIGHT_BOX_HEIGHT, ILI9341_WHITE);
CustomBox MinuteHighlightBox(120, TIME_HIGHLIGHT_BOX_YLOC, TIME_HIGHLIGHT_BOX_WIDTH, TIME_HIGHLIGHT_BOX_HEIGHT, ILI9341_WHITE);
CustomBox SecondHighlightBox(230, TIME_HIGHLIGHT_BOX_YLOC, TIME_HIGHLIGHT_BOX_WIDTH, TIME_HIGHLIGHT_BOX_HEIGHT, ILI9341_WHITE);
CustomBox MonthHighlightBox(72, DATE_HIGHLIGHT_BOX_YLOC, DATE_HIGHLIGHT_BOX_WIDTH, DATE_HIGHLIGHT_BOX_HEIGHT, ILI9341_WHITE);
CustomBox DayHighlightBox(132, DATE_HIGHLIGHT_BOX_YLOC, DATE_HIGHLIGHT_BOX_WIDTH, DATE_HIGHLIGHT_BOX_HEIGHT, ILI9341_WHITE);
CustomBox YearHighlightBox(178, DATE_HIGHLIGHT_BOX_YLOC, 90, DATE_HIGHLIGHT_BOX_HEIGHT, ILI9341_WHITE);
CustomBox TimeBox(TIME_BOX_X, TIME_BOX_Y, TIME_BOX_WIDTH, TIME_BOX_HEIGHT, ILI9341_BLACK);
CustomBox DateBox(DATE_BOX_X, DATE_BOX_Y, DATE_BOX_WIDTH, DATE_BOX_HEIGHT, ILI9341_BLACK);
enum AdjustmentState
{
ADJ_NONE = 0,
ADJ_HOUR,
ADJ_MIN,
ADJ_SEC,
ADJ_DAYOFWEEK,
ADJ_MONTH,
ADJ_DAY,
ADJ_YEAR
};
const char AdjValNameArray[8][9] = { "ADJ_NONE", "ADJ_HOUR", "ADJ_MIN", "ADJ_SEC", "ADJ_DOW", "ADJ_MNTH", "ADJ_DAY", "ADJ_YEAR" };
int aDaysInMonth[] = { 31,28,31,30,31,30,31,31,30,31,30,31 };
AdjustmentState CurAdjState = ADJ_NONE;
const int TOUCH_TIMEOUT_MSEC = 5000; //reverts to regular display if no further touch input
elapsedMillis mSecSinceLastTouch; //timer for touch timout
#pragma endregion Display & Adj Box Parameters
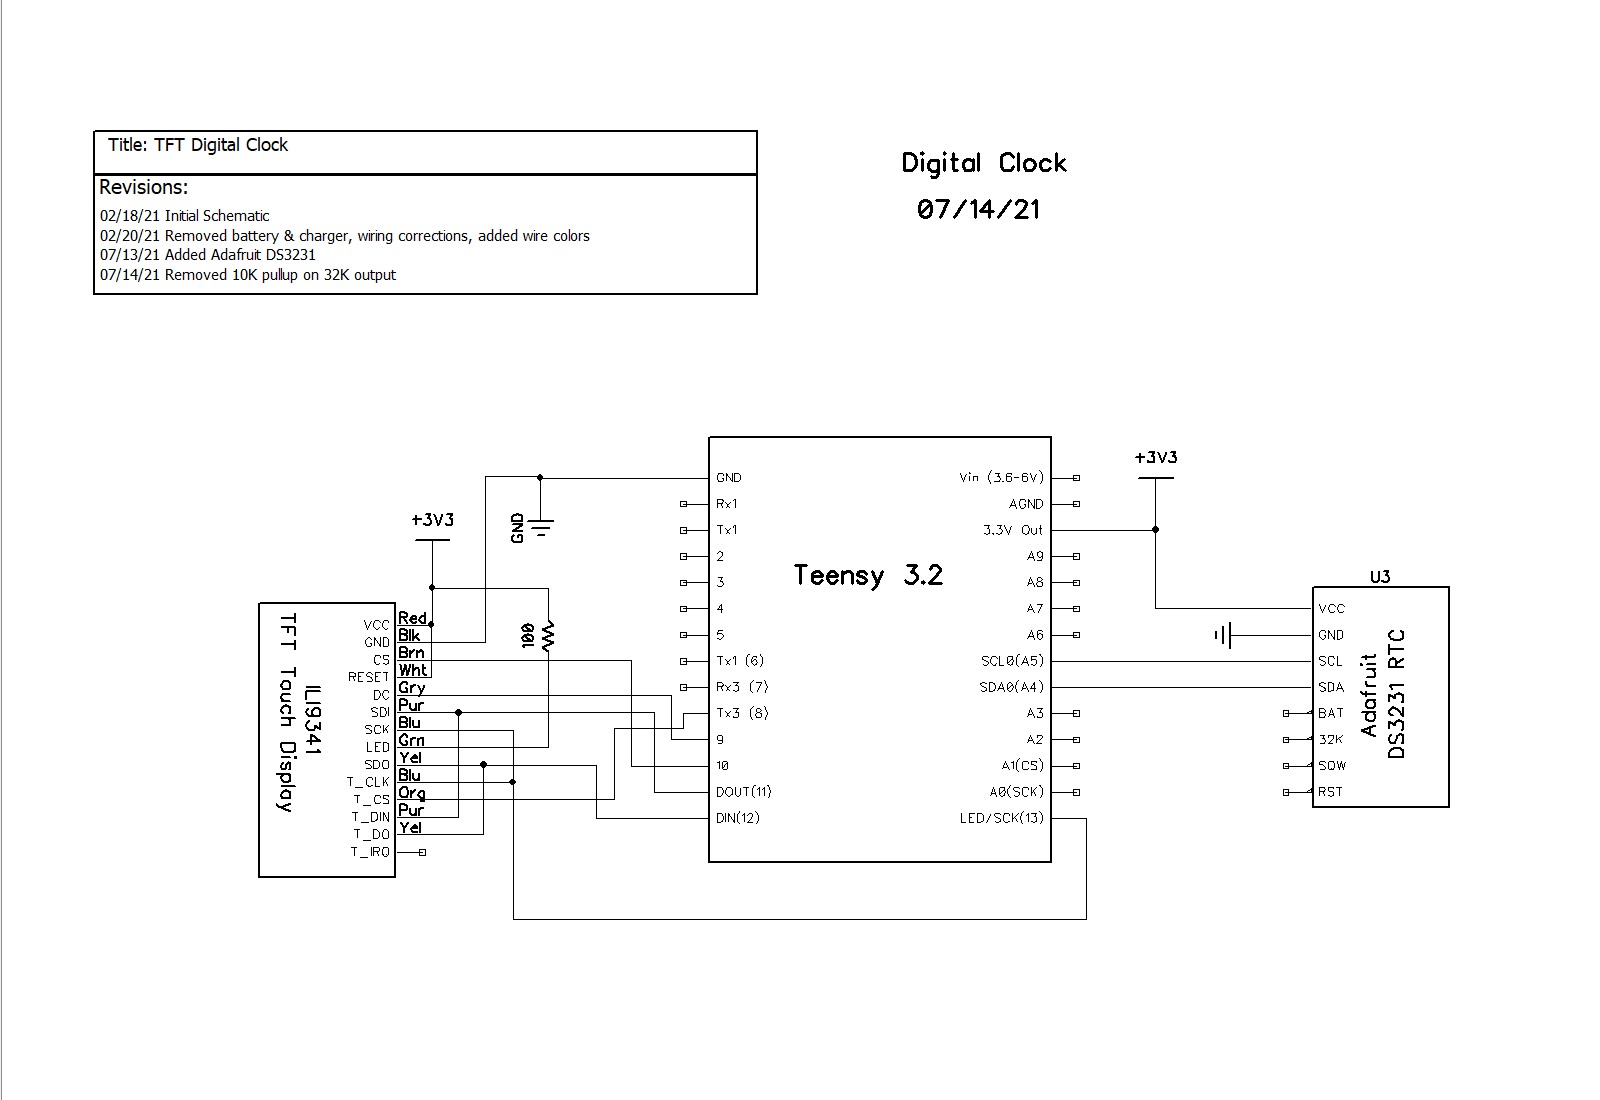
#pragma region RTC Support
#define FORCE_RTC_TO_LAST_COMPILE_TIME //uncomment to manually set RTC to last compile time
RTC_DS3231 rtc;
char daysOfTheWeek[7][12] = { "Sun", "Mon", "Tue", "Wed", "Thu", "Fri", "Sat" };
DateTime now, lastTime;
char buffer[100];
int lasthour = 0; //02/15/21 added to refresh screen on the hour
struct tStamp
{
unsigned long mSec;
byte RTC_Status;
};
#define DS3231_ADDRESS 0x68 ///< I2C address for DS3231
#define DS3231_STATUSREG 0x0F ///< Status register
#define RTCStatArraySize 10
#define RTCStatTime_IntervalMsec 100
tStamp RTCStatArray[RTCStatArraySize];
#pragma endregion RTC Support
void setup()
{
Serial.begin(9600);
delay(3000);
Serial.println("Teensy 3.2 TFT Clock Program");
#pragma region DISPLAY INITIALIZATION
Serial.println("Initializing TFT display");
tft.begin();
// Note: you can now set the SPI speed to any value
// the default value is 30Mhz, but most ILI9341 displays
// can handle at least 60Mhz and as much as 100Mhz
// tft.setClock(60000000);
tft.fillScreen(ILI9341_BLACK);
tft.setTextColor(ILI9341_YELLOW);
tft.setTextSize(2);
tft.setRotation(1);
#pragma endregion region DISPLAY INITIALIZATION
#pragma region TFT DIAGNOSTICS
#ifndef N0_DIAGNOSTICS
// read diagnostics (optional but can help debug problems)
uint8_t x = tft.readcommand8(ILI9341_RDMODE);
Serial.print("Display Power Mode: 0x"); Serial.println(x, HEX);
x = tft.readcommand8(ILI9341_RDMADCTL);
Serial.print("MADCTL Mode: 0x"); Serial.println(x, HEX);
x = tft.readcommand8(ILI9341_RDPIXFMT);
Serial.print("Pixel Format: 0x"); Serial.println(x, HEX);
x = tft.readcommand8(ILI9341_RDIMGFMT);
Serial.print("Image Format: 0x"); Serial.println(x, HEX);
x = tft.readcommand8(ILI9341_RDSELFDIAG);
Serial.print("Self Diagnostic: 0x"); Serial.println(x, HEX);
Serial.println(F("Benchmark Time (microseconds)"));
Serial.print(F("Screen fill "));
Serial.println(testFillScreen());
delay(200);
Serial.print(F("Text "));
Serial.println(testText());
delay(600);
Serial.print(F("Proportional Text "));
Serial.println(testProportionalText());
delay(600);
Serial.print(F("Lines "));
Serial.println(testLines(ILI9341_CYAN));
delay(200);
Serial.print(F("Horiz/Vert Lines "));
Serial.println(testFastLines(ILI9341_RED, ILI9341_BLUE));
delay(200);
Serial.print(F("Rectangles (outline) "));
Serial.println(testRects(ILI9341_GREEN));
delay(200);
Serial.print(F("Rectangles (filled) "));
Serial.println(testFilledRects(ILI9341_YELLOW, ILI9341_MAGENTA));
delay(200);
Serial.print(F("Circles (filled) "));
Serial.println(testFilledCircles(10, ILI9341_MAGENTA));
Serial.print(F("Circles (outline) "));
Serial.println(testCircles(10, ILI9341_WHITE));
delay(200);
Serial.print(F("Triangles (outline) "));
Serial.println(testTriangles());
delay(200);
Serial.print(F("Triangles (filled) "));
Serial.println(testFilledTriangles());
delay(200);
Serial.print(F("Rounded rects (outline) "));
Serial.println(testRoundRects());
delay(200);
Serial.print(F("Rounded rects (filled) "));
Serial.println(testFilledRoundRects());
delay(200);
Serial.println(F("Done!"));
#endif // !N0_DIAGNOSTICS
#pragma endregion region TFT DIAGNOSTICS
#pragma region RTC_SETUP
DateBox.Draw(&tft); //erase previous text
tft.setCursor(0, 0);
Serial.println("Initializing RTC...");
//tft.println("Initializing RTC...");
delay(1000);
if (!rtc.begin())
{
DateBox.Draw(&tft); //erase previous text
tft.setCursor(0, 0);
Serial.println("Couldn't find RTC");
tft.println("Couldn't find RTC");
while (1);
}
bool lp = rtc.lostPower();
Serial.print("lostPower() reports "); Serial.println(lp);
DateBox.Draw(&tft); //erase previous text
tft.setCursor(0, 0);
tft.printf("lostPower() = %d\n", lp);
delay(1000);
if (rtc.lostPower())
{
Serial.println("RTC lost power. Setting RTC to last compile time");
DateBox.Draw(&tft); //erase previous text
tft.setCursor(0, 0);
tft.println("RTC lost power. Setting RTC to last compile time");
// following line sets the RTC to the date & time this sketch was compiled
rtc.adjust(DateTime(F(__DATE__), F(__TIME__)));
}
#ifdef FORCE_RTC_TO_LAST_COMPILE_TIME
Serial.println("Forcing RTC to last compile time");
// following line sets the RTC to the date & time this sketch was compiled
rtc.adjust(DateTime(F(__DATE__), F(__TIME__)));
#endif //
//DateTime now = rtc.now();
now = rtc.now();
memset(buffer, '\0', 100);
GetDayDateTimeStringFromDateTime(now, buffer);
Serial.println("Retrieving Date/Time from RTC....");
Serial.print("Date String = "); Serial.println(buffer);
#pragma endregion RTC_SETUP
//DEBUG!!
//tft.println("Setting time to just before midnight");
//rtc.adjust(DateTime(2021, 02, 13, 00, 59, 45));
//DEBUG!!
//02/15/21 needed detect hour changes for screen refresh
now = rtc.now();
lasthour = now.hour();
mSecSinceLastClockUpdate = 0; //used to space out clock updates in loop()
}
void loop(void)
{
//Serial.printf("%lu: mSecSinceLastClockUpdate = %lu\n", millis(), (long int)mSecSinceLastClockUpdate);
delay(100);
//see if there is a touch anywhere
if (ts.touched())
{
mSecSinceLastTouch = 0; //reset the timeout watchdog
while (mSecSinceLastTouch < TOUCH_TIMEOUT_MSEC)
{
//Serial.printf("mSecSinceLastTouch = %lu\n", (unsigned long int)mSecSinceLastTouch);
TS_Point Tp = ts.getPoint();// Retrieve the touch point
if (Tp.z > 1000)
{
mSecSinceLastTouch = 0; //reset the timeout watchdog
TS_Point Dp = GetTouchPointInDisplayCoords(Tp);
CurAdjState = (AdjustmentState)AdjustTimeAndDate(Dp);
Serial.printf("Tp.z = %d: AdjustTimeAndDate(%d, %d) returns %s\n", Tp.z, Dp.x, Dp.y, AdjValNameArray[(int)CurAdjState]);
if (CurAdjState > ADJ_NONE)
{
ShowLongTimeDisplay();
ShowAdjButtons();
}
}
}
HideButtons();
HideHighlightBars();
ShowNormalTimeDisplay();
ShowDateDisplay();
CurAdjState = ADJ_NONE;
mSecSinceLastClockUpdate = 0;
}
if (mSecSinceLastClockUpdate > CLOCK_UPDATE_MSEC)
{
mSecSinceLastClockUpdate -= CLOCK_UPDATE_MSEC;
now = rtc.now();
ShowDateDisplay(); //Display day and date
//Display time
if (CurAdjState > ADJ_NONE)
{
ShowLongTimeDisplay();
}
else
{
ShowNormalTimeDisplay();
}
}
}
#pragma region DATE_TIME_FUNCTIONS
void GetDayDateTimeStringFromDateTime(DateTime dt, char* bufptr)
{
int mydayofweek = dt.dayOfTheWeek();
//mydayofweek = (mydayofweek < 0) ? 0 : mydayofweek; //guard for return of 0 from weekday()
int myday = dt.day();
int mymonth = dt.month();
int myyear = dt.year();
int myhour = dt.hour();
int mymin = dt.minute();
int mysec = dt.second();
char* dayofweek = (char*)daysOfTheWeek[mydayofweek];
sprintf(bufptr, "%s %4d/%02d/%02d at %02d:%02d:%02d", dayofweek, mymonth, myday, myyear, myhour, mymin, mysec);
}
void HourStringFromDateTime(DateTime dt, char* bufptr)
{
int hourval = dt.hour();
if (hourval > 12)
{
hourval -= 12;
}
//sprintf(bufptr, "%02d", hourval);
sprintf(bufptr, "%d", hourval);
}
void MinuteStringFromDateTime(DateTime dt, char* bufptr)
{
sprintf(bufptr, "%02d", dt.minute());
}
#pragma endregion DATE_TIME_FUNCTIONS
AdjustmentState AdjustTimeAndDate(TS_Point Dp)
{
AdjustmentState adjstate = ADJ_NONE;
DateTime newtime;
DateTime now = rtc.now();
int new_hour = 0; int new_minute = 0; int new_month = 0; int new_day = 0;
int cur_day = 0; //added 07/13/21
//Serial.printf("In AdjustTimeAndDate with CurAdjState = %d, at point (%d,%d)\n", CurAdjState, Dp.x, Dp.y);
switch (CurAdjState)
{
case ADJ_NONE:
if (TimeBox.TouchHit(Dp.x, Dp.y))
{
adjstate = ADJ_HOUR; //always start with hour
ShowHighlightBar(ADJ_HOUR);
}
else if (DateBox.TouchHit(Dp.x, Dp.y))
{
adjstate = ADJ_MONTH; //always start with month
ShowHighlightBar(ADJ_MONTH);
}
break;
case ADJ_HOUR:
Serial.print("In AdjustTimeAndDate ADJ_HOUR case\n");
adjstate = ADJ_HOUR;
if (PlusBox.TouchHit(Dp.x, Dp.y))
{
Serial.printf("Plus box touch at (%d,%d)\n", Dp.x, Dp.y);
Serial.printf("Old time is %d/%d/%d %d:%d\n", now.month(), now.day(), now.year(), now.hour(), now.minute());
new_hour = now.hour() + 1;
if (new_hour >= 24)
{
new_hour -= 24;
}
newtime = DateTime(now.year(), now.month(), now.day(), new_hour, now.minute(), now.second());
Serial.printf("New time is %d/%d/%d %d:%d\n", newtime.month(), newtime.day(), newtime.year(), newtime.hour(), newtime.minute());
rtc.adjust(newtime);
now = rtc.now();
Serial.printf("RTC now set to %d/%d/%d %d:%d\n", now.day(), now.month(), now.year(), now.hour(), now.minute());
ShowLongTimeDisplay();
delay(500); //delay for a while to avoid multiple 'add' operations
}
else if (MinusBox.TouchHit(Dp.x, Dp.y))
{
Serial.printf("Minus box touch at (%d,%d)\n", Dp.x, Dp.y);
Serial.printf("Old time is %d/%d/%d %d:%d\n", now.month(), now.day(), now.year(), now.hour(), now.minute());
new_hour = now.hour() - 1;
if (new_hour < 0)
{
new_hour += 24;
}
newtime = DateTime(now.year(), now.month(), now.day(), new_hour, now.minute(), now.second());
Serial.printf("New time is %d/%d/%d %d:%d\n", newtime.month(), newtime.day(), newtime.year(), newtime.hour(), newtime.minute());
rtc.adjust(newtime);
now = rtc.now();
Serial.printf("RTC now set to %d/%d/%d %d:%d\n", now.day(), now.month(), now.year(), now.hour(), now.minute());
ShowLongTimeDisplay();
delay(500); //delay for a while to avoid multiple 'add' operations
}
else if (NextBox.TouchHit(Dp.x, Dp.y))
{
Serial.printf("Next box touch at (%d,%d)\n", Dp.x, Dp.y);
adjstate = ADJ_MIN;
ShowHighlightBar(ADJ_MIN);
delay(500); //prevent multiple NEXT transitions
}
break;
case ADJ_MIN:
Serial.print("In AdjustTimeAndDate ADJ_MIN case\n");
adjstate = ADJ_MIN;
if (PlusBox.TouchHit(Dp.x, Dp.y))
{
Serial.printf("Plus box touch at (%d,%d)\n", Dp.x, Dp.y);
Serial.printf("Old time is %d/%d/%d %2d:%2d\n", now.month(), now.day(), now.year(), now.hour(), now.minute());
new_minute = now.minute() + 1;
if (new_minute >= 60)
{
new_minute = 0;
}
newtime = DateTime(now.year(), now.month(), now.day(), now.hour(), new_minute, now.second());
Serial.printf("New time is %2d:%2d\n", newtime.hour(), newtime.minute());
rtc.adjust(newtime);
now = rtc.now();
Serial.printf("RTC now set to %2d:%2d\n", now.day(), now.hour(), now.minute());
ShowLongTimeDisplay();
delay(500); //delay for a while to avoid multiple 'add' operations
}
else if (MinusBox.TouchHit(Dp.x, Dp.y))
{
Serial.printf("Minus box touch at (%d,%d)\n", Dp.x, Dp.y);
Serial.printf("ADJ_MIN case in DoMinusOp(). Decrementing Minute Value\n");
Serial.printf("Old time is %2d:%2d\n", now.hour(),now.minute());
new_minute = now.minute() - 1;
if (new_minute < 0)
{
Serial.printf("adjusting for 00/59 rollover\n");
new_minute = 59;
}
newtime = DateTime(now.year(), now.month(), now.day(), now.hour(), new_minute);
rtc.adjust(newtime);
now = rtc.now();
Serial.printf("New time is %d:%d\n", now.hour(), now.minute());
Serial.printf("RTC now set to %2d:%2d\n", now.hour(), now.minute());
ShowLongTimeDisplay();
delay(500); //delay for a while to avoid multiple 'decrement' operations
}
else if (NextBox.TouchHit(Dp.x, Dp.y))
{
//Serial.printf("Next box touch at (%d,%d)\n", Dp.x, Dp.y);
adjstate = ADJ_SEC;
ShowHighlightBar(ADJ_SEC);
delay(500); //prevent multiple NEXT transitions
}
break;
case ADJ_SEC:
Serial.print("In AdjustTimeAndDate ADJ_SEC case\n");
adjstate = ADJ_SEC;
//both PLUS & MINUS operations simply reset seconds to zero
if (PlusBox.TouchHit(Dp.x, Dp.y))
{
Serial.printf("Plus box touch at (%d,%d)\n", Dp.x, Dp.y);
Serial.printf("Old time is %d/%d/%d %d:%d:%d\n", now.month(), now.day(), now.year(), now.hour(), now.minute(), now.second());
newtime = DateTime(now.year(), now.month(), now.day(), now.hour(), now.minute(), 0);
Serial.printf("New time is %d/%d/%d %d:%d:%d\n", newtime.month(), newtime.day(), newtime.year(), newtime.hour(), newtime.minute(), newtime.second());
rtc.adjust(newtime);
now = rtc.now();
Serial.printf("RTC now set to %d/%d/%d %d:%d:%d\n", now.day(), now.month(), now.year(), now.hour(), now.minute(), now.second());
ShowLongTimeDisplay();
delay(500); //delay for a while to avoid multiple 'add' operations
}
else if (MinusBox.TouchHit(Dp.x, Dp.y))
{
Serial.printf("Minus box touch at (%d,%d)\n", Dp.x, Dp.y);
Serial.printf("Old time is %d/%d/%d %d:%d:%d\n", now.month(), now.day(), now.year(), now.hour(), now.minute(), now.second());
newtime = DateTime(now.year(), now.month(), now.day(), now.hour(), now.minute(), 0);
Serial.printf("New time is %d/%d/%d %d:%d:%d\n", newtime.month(), newtime.day(), newtime.year(), newtime.hour(), newtime.minute(), newtime.second());
rtc.adjust(newtime);
now = rtc.now();
Serial.printf("RTC now set to %d/%d/%d %d:%d:%d\n", now.day(), now.month(), now.year(), now.hour(), now.minute(), now.second());
ShowLongTimeDisplay();
delay(500); //delay for a while to avoid multiple 'add' operations
}
else if (NextBox.TouchHit(Dp.x, Dp.y))
{
//Serial.printf("Next box touch at (%d,%d)\n", Dp.x, Dp.y);
adjstate = ADJ_HOUR;
ShowHighlightBar(ADJ_HOUR);
delay(500); //prevent multiple NEXT transitions
}
break;
case ADJ_DAYOFWEEK:
break;
case ADJ_MONTH: //07/13/21 rev to watch for next/prev month max days
Serial.print("In AdjustTimeAndDate ADJ_MONTH case\n");
adjstate = ADJ_MONTH;
if (PlusBox.TouchHit(Dp.x, Dp.y))
{
Serial.printf("Plus box touch at (%d,%d)\n", Dp.x, Dp.y);
Serial.printf("Old time is %d/%d/%d %d:%d\n", now.month(), now.day(), now.year(), now.hour(), now.minute());
new_month = now.month() + 1;
if (new_month > 12)
{
new_month = 1; //07/13/21 bugfix
}
//07/13/21 have to adjust if current dayval > max for new month
cur_day = now.day();
if (cur_day > aDaysInMonth[new_month - 1])
{
Serial.printf("%d Exceeds max days for new month (%d for %d)\n", cur_day, aDaysInMonth[new_month - 1], new_month);
new_day = aDaysInMonth[new_month - 1];
}
else
{
new_day = cur_day;
}
newtime = DateTime(now.year(), new_month, new_day, now.hour(), now.minute(), now.second());
Serial.printf("New time is %d/%d/%d %2d:%2d\n", newtime.month(), newtime.day(), newtime.year(), newtime.hour(), newtime.minute());
rtc.adjust(newtime);
now = rtc.now();
Serial.printf("RTC now set to %d/%d/%d %2d:%2d\n", now.month(), now.day(), now.year(), now.hour(), now.minute());
ShowDateDisplay();
delay(500); //delay for a while to avoid multiple 'add' operations
}
else if (MinusBox.TouchHit(Dp.x, Dp.y))
{
Serial.printf("Minus box touch at (%d,%d)\n", Dp.x, Dp.y);
Serial.printf("Old time is %d/%d/%d %2d:%2d\n", now.month(), now.day(), now.year(), now.hour(), now.minute());
new_month = now.month() - 1;
/*new_month = (new_month <= 0) ? 12 : new_month; */
if (new_month <= 0)
{
new_month = 12; //no need to check max days, as feb max is 28 and dec max is 31
}
else
{
//have to check max days for new month
cur_day = now.day();
if (cur_day > aDaysInMonth[new_month - 1])
{
Serial.printf("%d Exceeds max days for new month (%d for %d)\n", cur_day, aDaysInMonth[new_month - 1], new_month);
new_day = aDaysInMonth[new_month - 1];
}
else new_day = cur_day;
}
//newtime = DateTime(now.year(), new_month, now.day(), now.hour(), now.minute(), now.second());
newtime = DateTime(now.year(), new_month, new_day, now.hour(), now.minute(), now.second());
Serial.printf("New time is %d/%d/%d %2d:%2d\n", newtime.month(), newtime.day(), newtime.year(), newtime.hour(), newtime.minute());
rtc.adjust(newtime);
now = rtc.now();
Serial.printf("RTC now set to %d/%d/%d %2d:%2d\n", now.day(), now.month(), now.year(), now.hour(), now.minute());
ShowDateDisplay();
delay(500); //delay for a while to avoid multiple 'add' operations
}
else if (NextBox.TouchHit(Dp.x, Dp.y))
{
//Serial.printf("Next box touch at (%d,%d)\n", Dp.x, Dp.y);
adjstate = ADJ_DAY;
ShowHighlightBar(ADJ_DAY);
delay(500); //prevent multiple NEXT transitions
}
break;
case ADJ_DAY:
Serial.print("In AdjustTimeAndDate ADJ_DAY case\n");
adjstate = ADJ_DAY;
if (PlusBox.TouchHit(Dp.x, Dp.y))
{
Serial.printf("Plus box touch at (%d,%d)\n", Dp.x, Dp.y);
Serial.printf("Old time is %d/%d/%d %2d:%2d\n", now.month(), now.day(), now.year(), now.hour(), now.minute());
new_day = AdjustDayValue(now.month(), now.day() + 1); //not all months have same number of days
newtime = DateTime(now.year(), now.month(), new_day, now.hour(), now.minute(), now.second());
Serial.printf("New time is %d/%d/%d %d:%d\n", newtime.month(), newtime.day(), newtime.year(), newtime.hour(), newtime.minute());
rtc.adjust(newtime);
now = rtc.now();
Serial.printf("RTC now set to %d/%d/%d %d:%d\n", now.day(), now.month(), now.year(), now.hour(), now.minute());
ShowDateDisplay();
delay(500); //delay for a while to avoid multiple 'add' operations
}
else if (MinusBox.TouchHit(Dp.x, Dp.y))
{
Serial.printf("Minus box touch at (%d,%d)\n", Dp.x, Dp.y);
Serial.printf("Old time is %d/%d/%d %d:%d\n", now.month(), now.day(), now.year(), now.hour(), now.minute());
new_day = now.day() - 1;
new_day = (new_day <= 0) ? aDaysInMonth[now.month() - 1] : new_day;
newtime = DateTime(now.year(), now.month(), new_day, now.hour(), now.minute(), now.second());
Serial.printf("New time is %d/%d/%d %d:%d\n", newtime.month(), newtime.day(), newtime.year(), newtime.hour(), newtime.minute());
rtc.adjust(newtime);
now = rtc.now();
Serial.printf("RTC now set to %d/%d/%d %d:%d\n", now.day(), now.month(), now.year(), now.hour(), now.minute());
ShowDateDisplay();
delay(500); //delay for a while to avoid multiple 'add' operations
}
else if (NextBox.TouchHit(Dp.x, Dp.y))
{
//Serial.printf("Next box touch at (%d,%d)\n", Dp.x, Dp.y);
adjstate = ADJ_YEAR;
ShowHighlightBar(ADJ_YEAR);
delay(500); //prevent multiple NEXT transitions
}
break;
case ADJ_YEAR:
Serial.print("In AdjustTimeAndDate ADJ_YEAR case\n");
adjstate = ADJ_YEAR;
if (PlusBox.TouchHit(Dp.x, Dp.y))
{
Serial.printf("Plus box touch at (%d,%d)\n", Dp.x, Dp.y);
Serial.printf("Old time is %d/%d/%d %2d:%2d\n", now.month(), now.day(), now.year(), now.hour(), now.minute());
newtime = DateTime(now.year() + 1, now.month(), now.day(), now.hour(), now.minute(), now.second());
Serial.printf("New time is %d/%d/%d %2d:%2d\n", newtime.month(), newtime.day(), newtime.year(), newtime.hour(), newtime.minute());
rtc.adjust(newtime);
now = rtc.now();
Serial.printf("RTC now set to %d/%d/%d %2d:%2d\n", now.month(), now.day(), now.year(), now.hour(), now.minute());
ShowDateDisplay();
delay(500); //delay for a while to avoid multiple 'add' operations
}
else if (MinusBox.TouchHit(Dp.x, Dp.y))
{
Serial.printf("Minus box touch at (%d,%d)\n", Dp.x, Dp.y);
Serial.printf("Old time is %d/%d/%d %2d:%2d\n", now.month(), now.day(), now.year(), now.hour(), now.minute());
newtime = DateTime(now.year() - 1, now.month(), now.day(), now.hour(), now.minute(), now.second());
Serial.printf("New time is %d/%d/%d %2d:%2d\n", newtime.month(), newtime.day(), newtime.year(), newtime.hour(), newtime.minute());
rtc.adjust(newtime);
now = rtc.now();
Serial.printf("RTC now set to %d/%d/%d %d:%d\n", now.day(), now.month(), now.year(), now.hour(), now.minute());
ShowDateDisplay();
delay(500); //delay for a while to avoid multiple 'add' operations
}
else if (NextBox.TouchHit(Dp.x, Dp.y))
{
//Serial.printf("Next box touch at (%d,%d)\n", Dp.x, Dp.y);
adjstate = ADJ_MONTH;
ShowHighlightBar(ADJ_MONTH);
delay(500); //prevent multiple NEXT transitions
}
break;
default:
break;
}
//Serial.printf("AdjustTimeAndDate(%d, %d) returns %d\n", Dp.x, Dp.y, (int)adjstate);
return adjstate;
}
#pragma region Helper Functions
TS_Point GetTouchPointInDisplayCoords(TS_Point Tp)
{
//Purpose: Retrieve a touch point in display coordinate system
//Inputs:
// Rotation value
// Mapping values
// TS_Point from touch chip
//Outputs:
// TS_Point object containing touch (X,Y) in display coordinates
//Plan:
// Step1: Retrieve touch point from touch chip
// Step2: Map to display coordinates taking rotation into account
//Step1: Retrieve touch point from touch chip
//TS_Point Tp = ts.getPoint();
TS_Point Dp;
//Step2: Map to display coordinates taking rotation into account
#ifdef SCREEN_ORIENTATION_1
Dp.x = map(Tp.x, TS_MAXX, TS_MINX, 0, tft.width());
Dp.y = map(Tp.y, TS_MAXY, TS_MINY, 0, tft.height());
#else
#endif
////DEBUG!!
//Serial.printf(" GetTouchPointInDisplayCoords: %lu\t%d\t%d\t%d\t%d\t%d\n",
// millis(), Tp.x, Tp.y, Tp.z, Dp.x, Dp.y);
////DEBUG!!
return Dp;
}
void ShowAdjButtons()
{
Serial.printf("In ShowAdjButtons\n");
HideButtons();
//03/13/21 new centering feature works great!
NextBox.Draw(&tft, "NEXT", ILI9341_BLACK, Arial_20, true);
PlusBox.Draw(&tft, "+", ILI9341_BLACK, Arial_40, true);
MinusBox.Draw(&tft, "-", ILI9341_BLACK, Arial_40, true);
}
void HideButtons()
{
PlusBox.Draw(&tft, ILI9341_BLACK);
MinusBox.Draw(&tft, ILI9341_BLACK);
NextBox.Draw(&tft, ILI9341_BLACK);
}
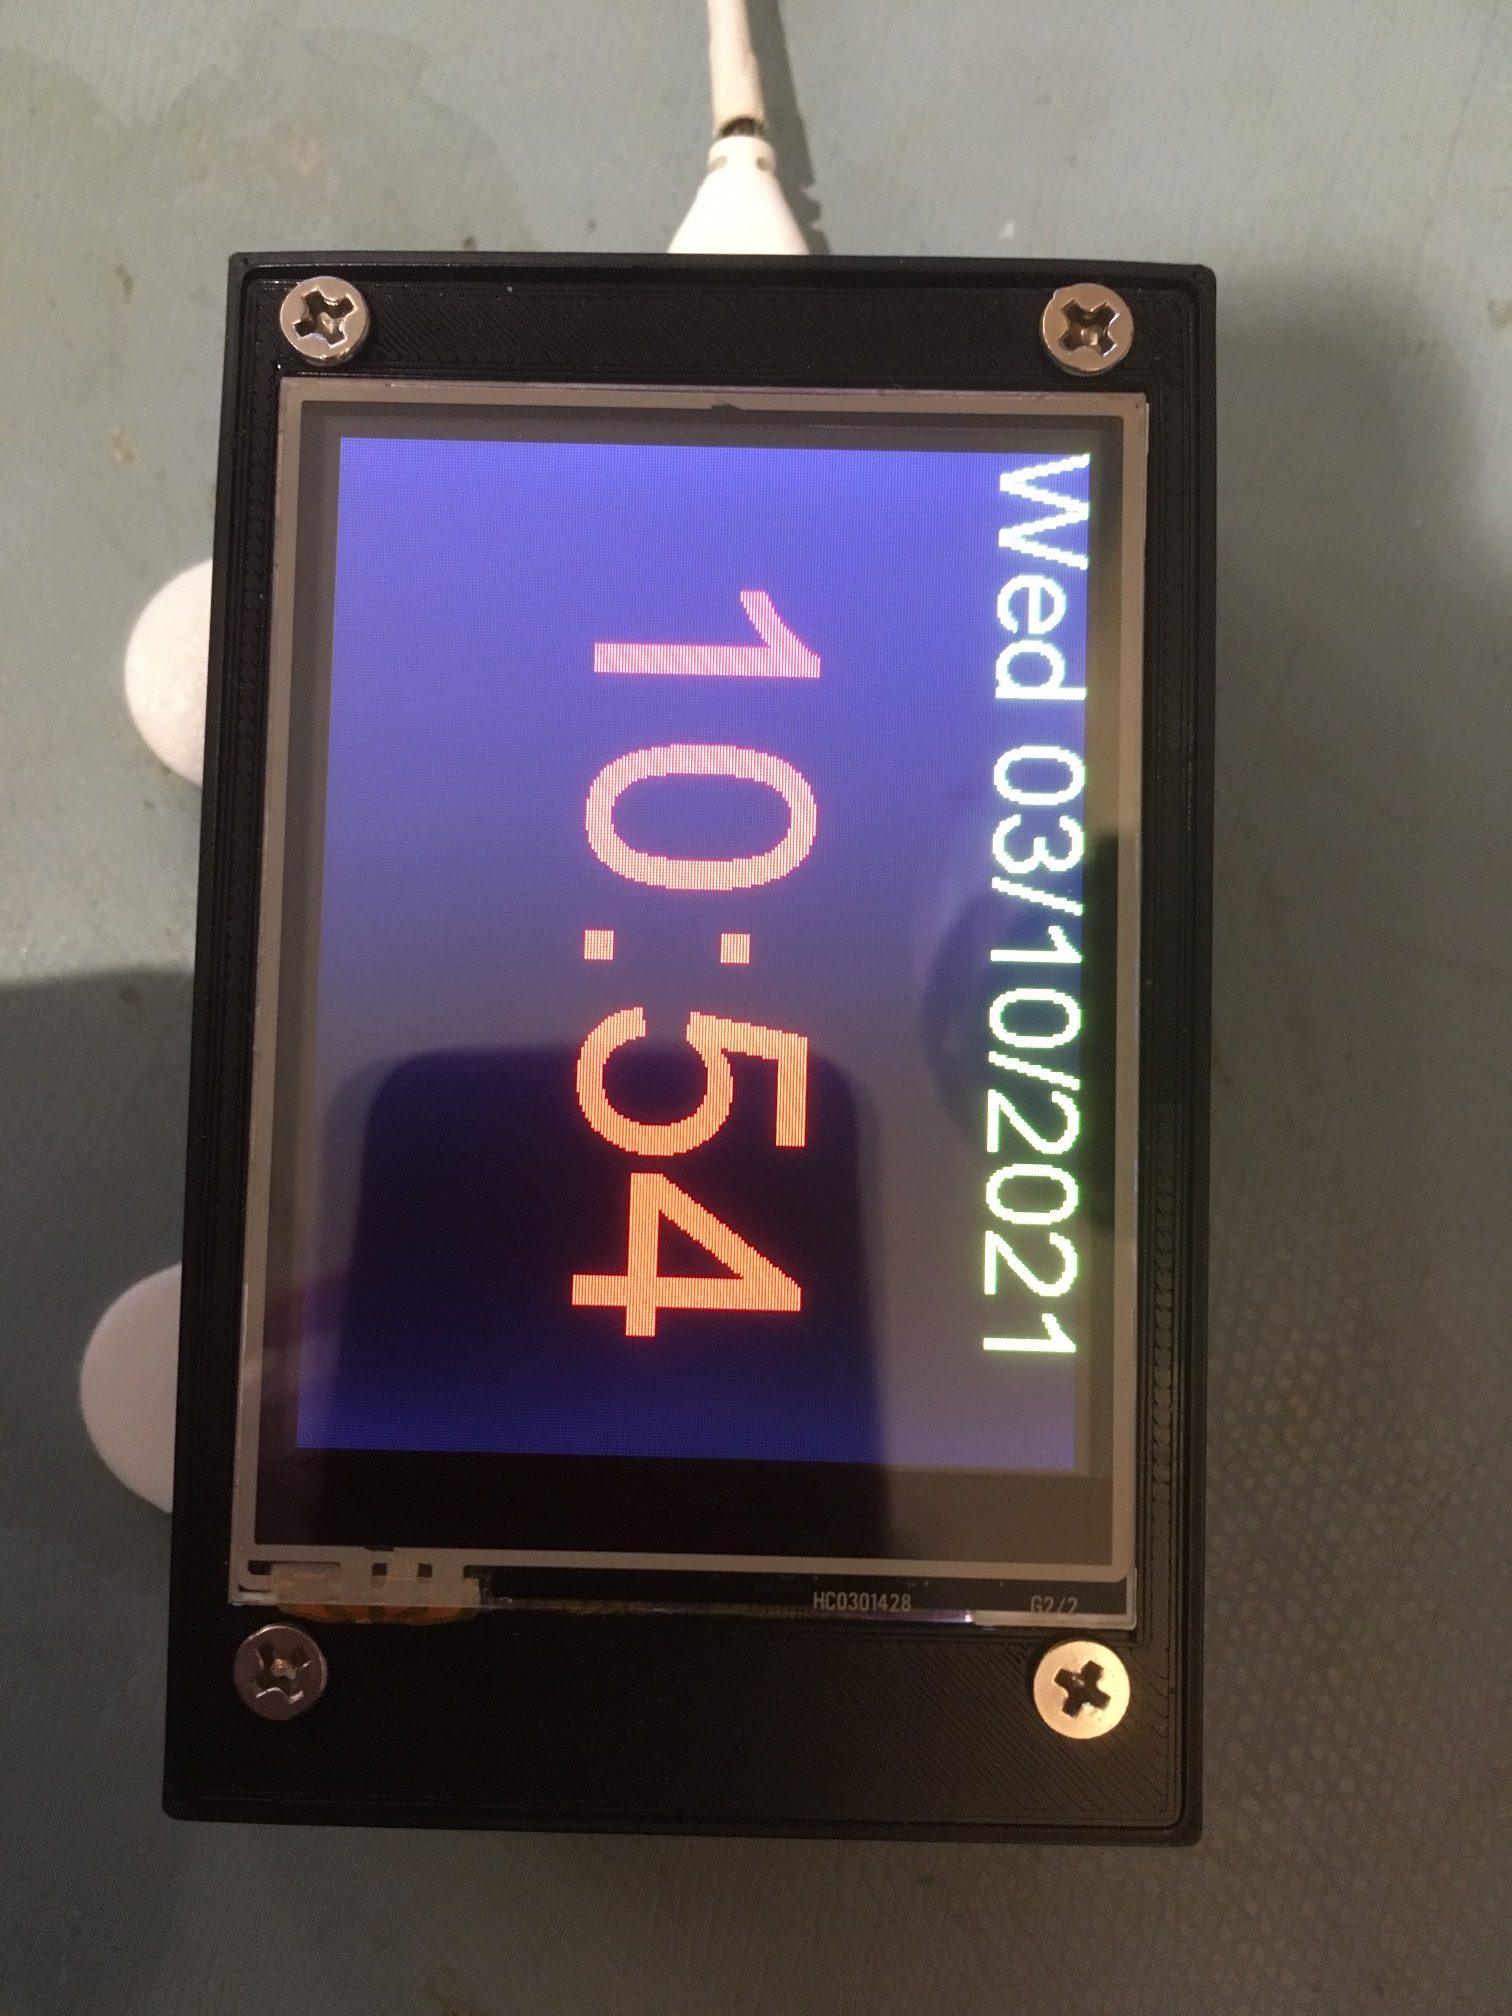
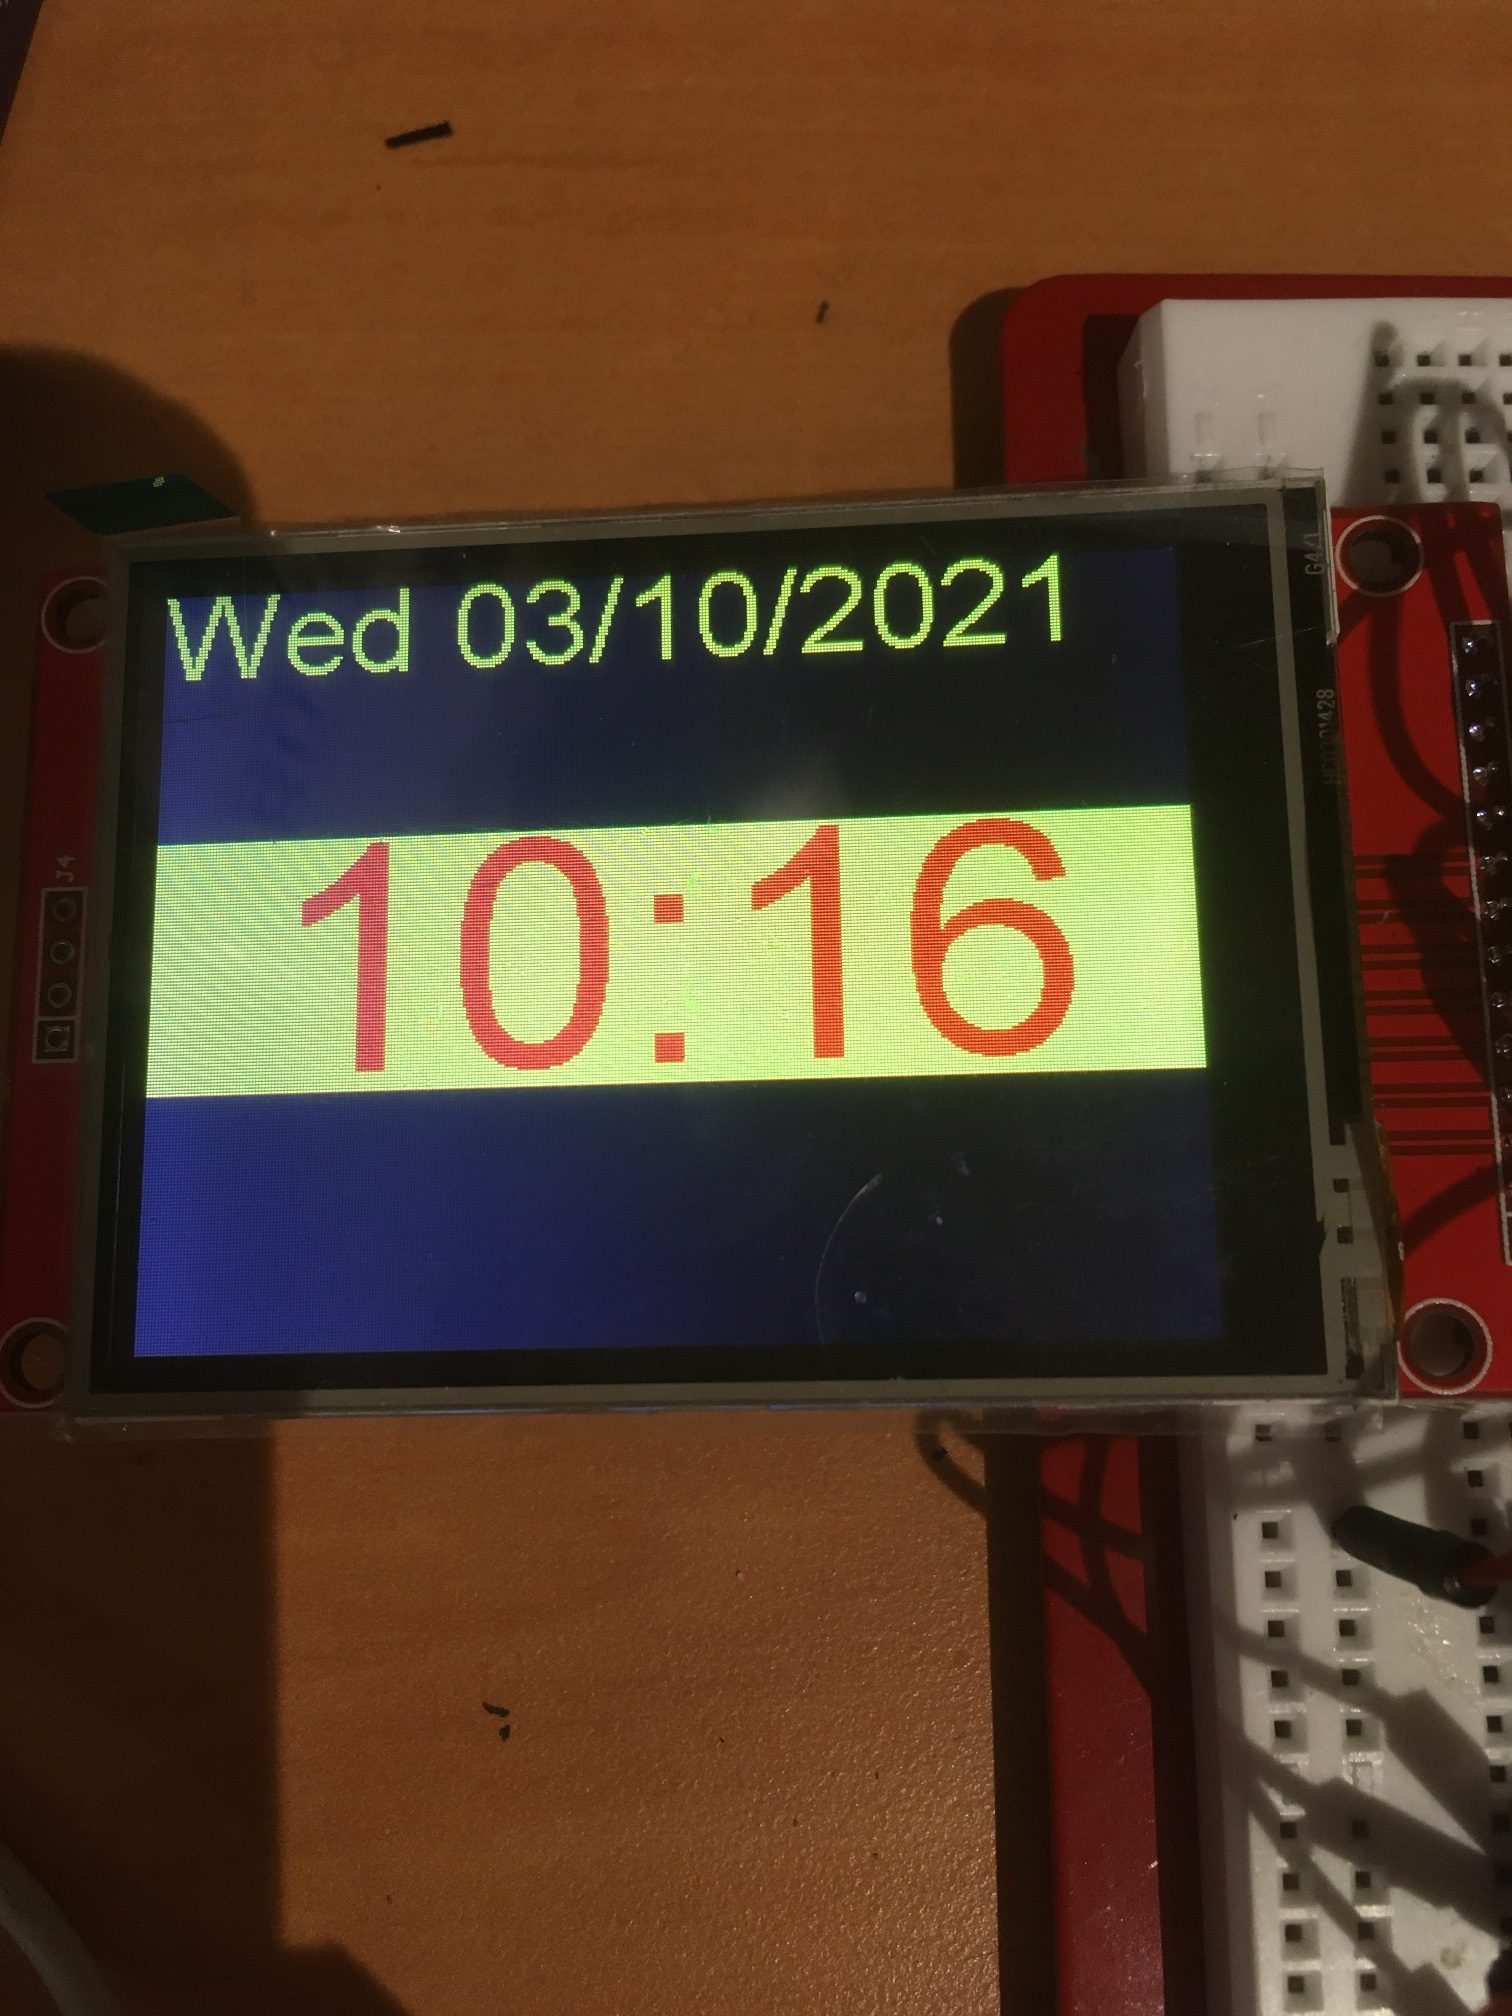
void ShowNormalTimeDisplay()
{
//Serial.printf("In ShowNormalTimeDisplay\n");
now = rtc.now();
int hournum = now.hour();
//guard against 1259->1300 && 2359->0000 transitions
if (hournum > 12)
{
hournum -= 12;
}
else if (hournum == 0)
{
hournum += 12;
}
hournum = (hournum > 12) ? hournum - 12 : hournum;
tft.setCursor(0, 100);
TimeBox.Draw(&tft); //redraws black background
tft.setTextColor(ILI9341_RED);
tft.setFont(Arial_72);
tft.setCursor(160, 120, true);//try the text centering feature
tft.printf("%2d:%02d", hournum, now.minute());
}
void ShowLongTimeDisplay()
{
//Serial.printf("In ShowLongTimeDisplay\n");
now = rtc.now();
tft.setTextColor(ILI9341_RED);
tft.setCursor(160, 120, true);//try the text centering feature
tft.setFont(Arial_60);
TimeBox.Draw(&tft); //redraws black background
int hournum = now.hour();
//guard against 1259->1300 && 2359->0000 transitions
if (hournum > 12)
{
hournum -= 12;
}
else if (hournum == 0)
{
hournum += 12;
}
hournum = (hournum > 12) ? hournum - 12 : hournum;
tft.printf("%2d:%02d:%02d", hournum, now.minute(), now.second());
}
void ShowHighlightBar(AdjustmentState adjstate)
{
switch (adjstate)
{
case ADJ_NONE:
Serial.printf("ADJ_NONE case in ShowHighlightBox()\n");
HideHighlightBars();
break;
case ADJ_HOUR:
HideHighlightBars();
HourHighlightBox.Draw(&tft);
break;
case ADJ_MIN:
HideHighlightBars();
MinuteHighlightBox.Draw(&tft);
break;
case ADJ_SEC:
HideHighlightBars();
SecondHighlightBox.Draw(&tft);
break;
case ADJ_DAYOFWEEK:
break;
case ADJ_MONTH:
HideHighlightBars();
MonthHighlightBox.Draw(&tft);
break;
case ADJ_DAY:
HideHighlightBars();
DayHighlightBox.Draw(&tft);
break;
case ADJ_YEAR:
HideHighlightBars();
YearHighlightBox.Draw(&tft);
break;
default:
break;
}
}
void HideHighlightBars()
{
tft.fillRect(0, DATE_HIGHLIGHT_BOX_YLOC, ALL_DATE_HIGHLIGHT_BOX_WIDTH, DATE_HIGHLIGHT_BOX_HEIGHT, ILI9341_BLACK);
tft.fillRect(0, TIME_HIGHLIGHT_BOX_YLOC, ALL_TIME_HIGHLIGHT_BOX_WIDTH, TIME_HIGHLIGHT_BOX_HEIGHT, ILI9341_BLACK);
}
void ShowDateDisplay()
{
DateTime now = rtc.now();
DateBox.Draw(&tft);
tft.setTextColor(ILI9341_YELLOW);
tft.setCursor(0, 0);
//tft.setTextSize(3);
tft.setFont(Arial_28);
tft.printf("%s %02d/%02d/%02d\n",
daysOfTheWeek[now.dayOfTheWeek()], now.month(), now.day(), now.year());
}
int AdjustDayValue(int month, int day)
{
//Notes:
// 07/13/21 rev to handle negative day values
if (day > aDaysInMonth[month - 1])
{
Serial.printf("%d is greater than max days (%d) for this month - setting to 1\n", day, aDaysInMonth[month - 1]);
return 1;
}
//07/13/21 bugfix
else if (day <= 0)
{
int newdaynum = aDaysInMonth[month - 1];
Serial.printf("%d is <= 0: set to max days (%d) for this month\n", day, newdaynum);
return newdaynum;
}
else
{
return day;
}
}
#pragma endregion Helper Functions