Posted 16 February 2023
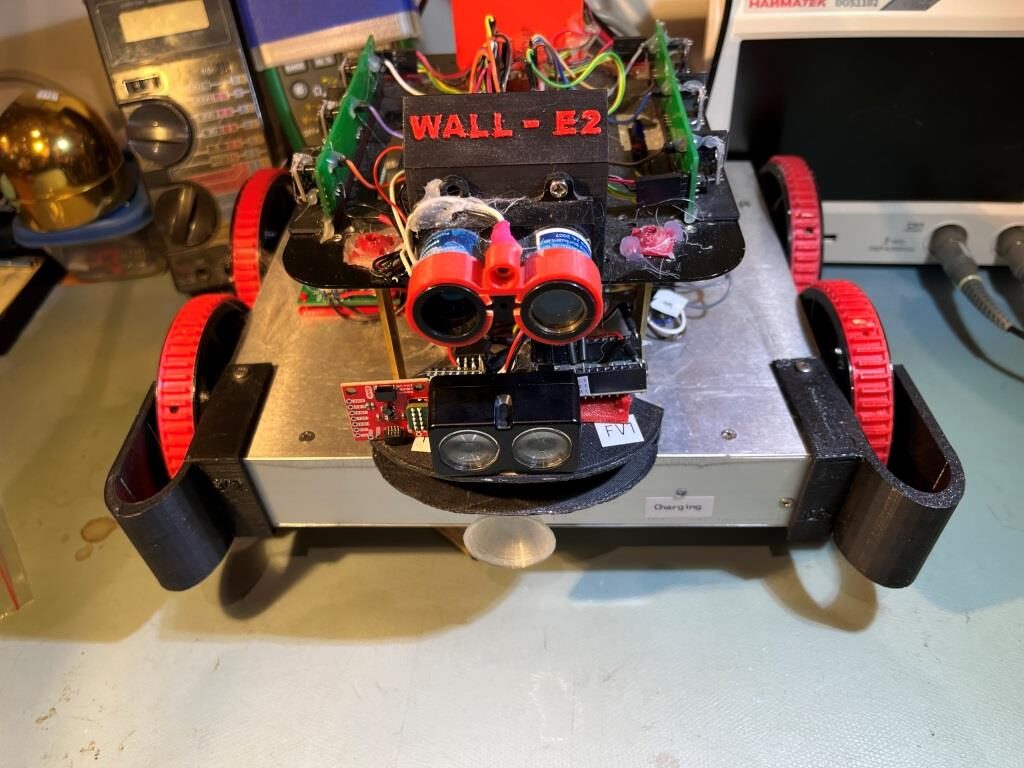
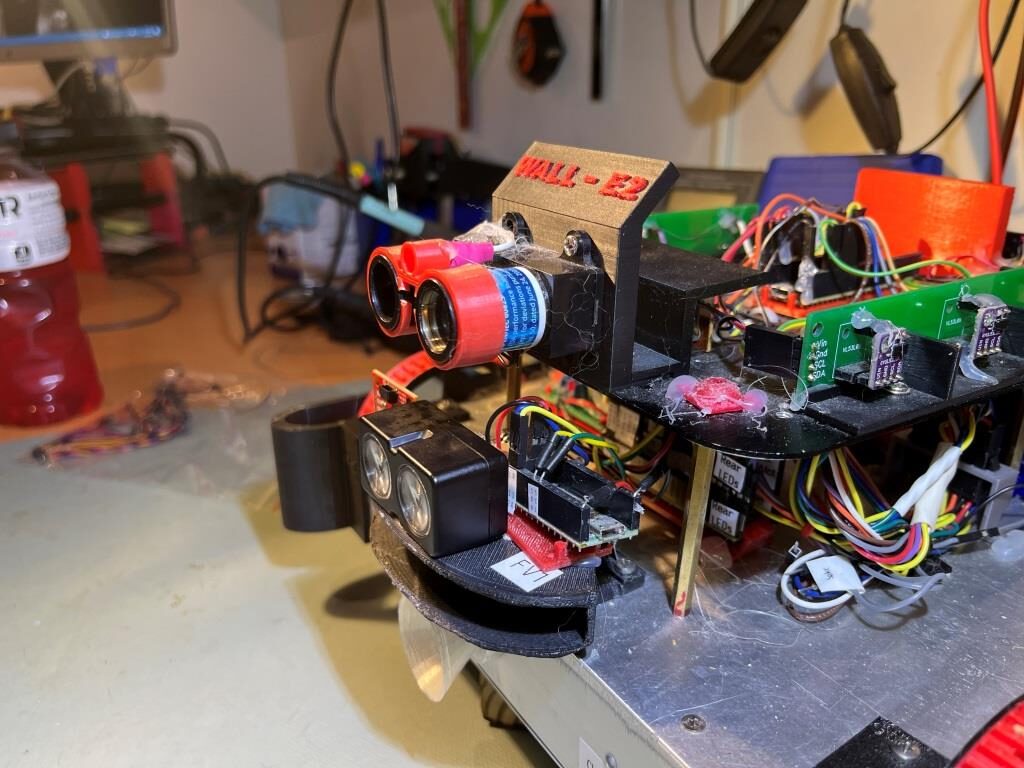
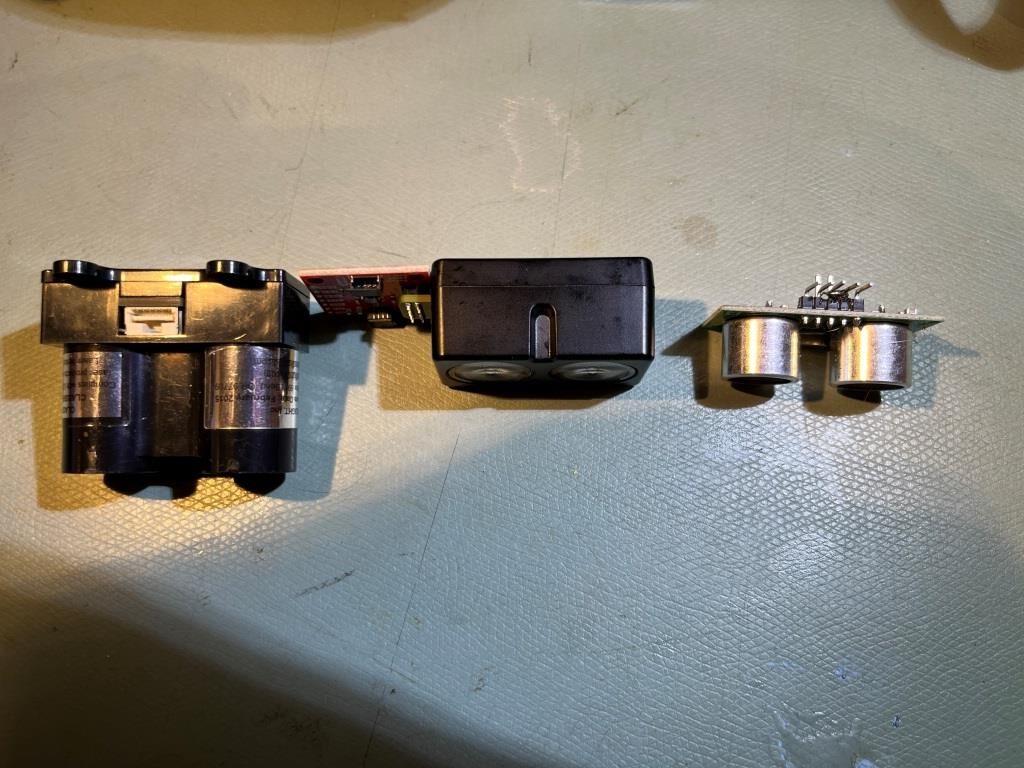
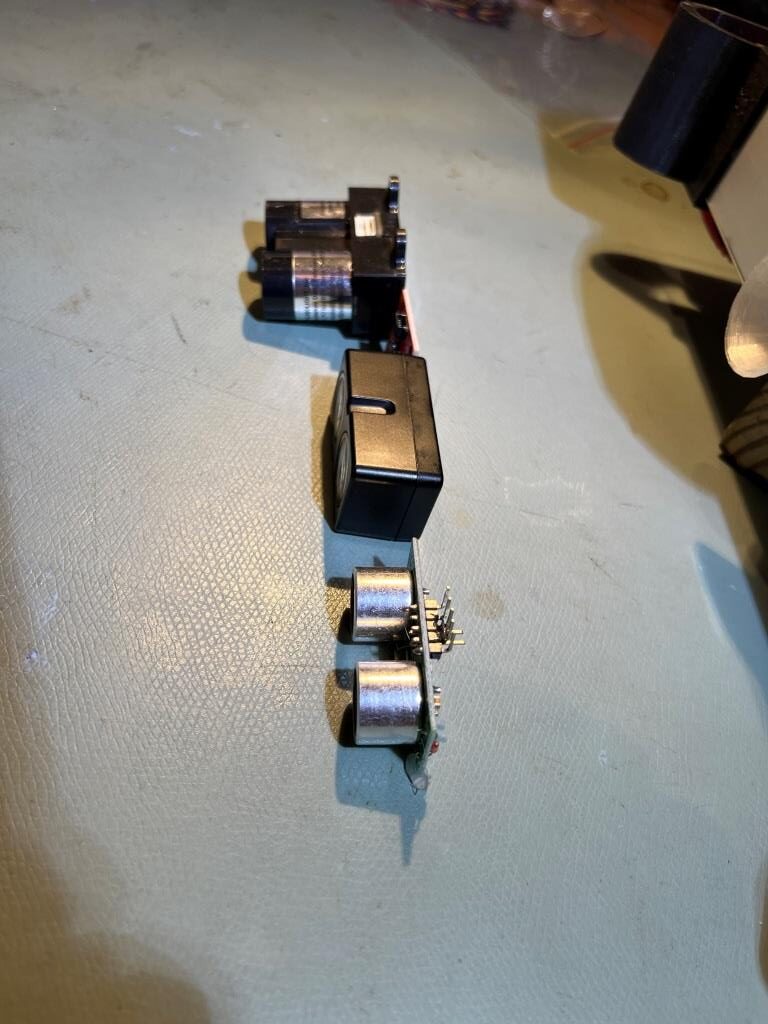
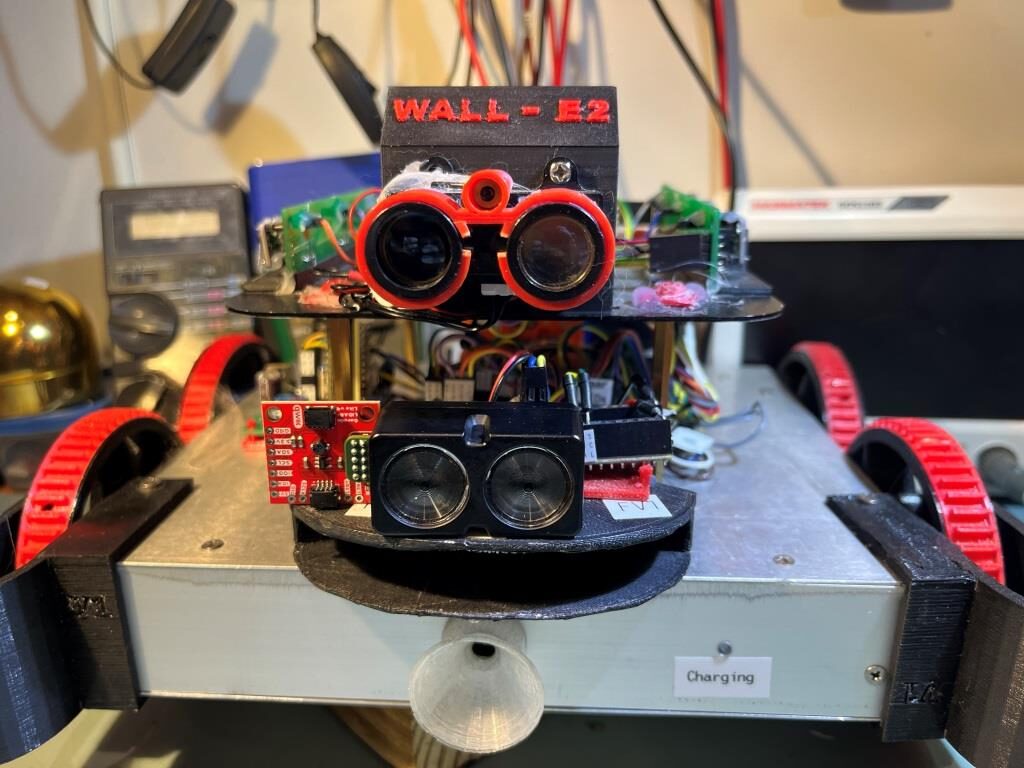
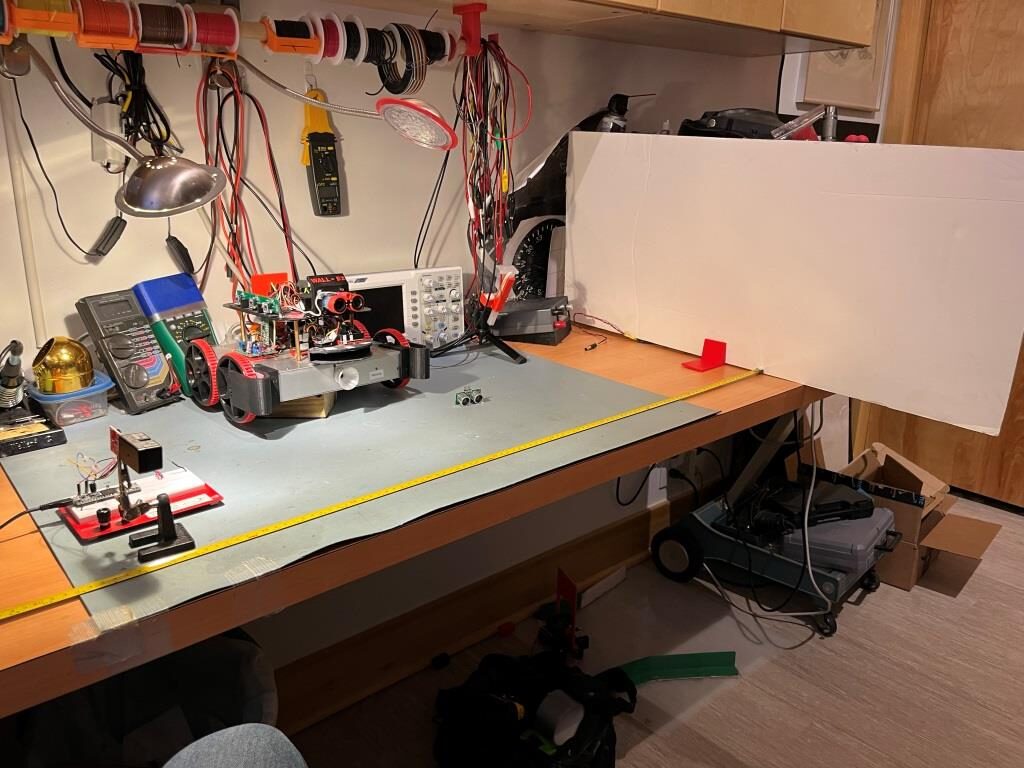
A week or so ago, while finishing up my ‘WallE3_Complete Testing‘ post, I discovered that the reason I (or at least WallE3, my autonomous wall-following robot) was experiencing STUCK_AHEAD errors was because my current forward distance sensor, a Pulsed Light ‘Blue Label’ LIDAR system, couldn’t measure beyond about 4m. Anything beyond that just got reported as 4m (or as a zero, which I converted to 4m). What that meant was that if WallE3 was wall tracking with a lot of open space ahead, it’s sensed distance was a constant 4m, which eventually (eventually being about 5sec) caused my distance variance calculation to go below the ‘stuck’ threshold, and ‘voila!’ STUCK_AHEAD error. I thought about some work-arounds, but there weren’t any good ones that didn’t come with a lot of downside, so I started looking at the new (well, at least new to me) Garmin LIDAR-Lite V4 LED time-of-flight distance sensor. I ordered one from Sparkfun, and it just arrived today – yay! Now to find out if this will really solve my ‘STUCK’ problem. The Garmin LIDAR is significantly smaller and lighter than my current Pulsed Light ‘Blue Label’ LIDAR Lite. I’ve included some photos here for context/scaling:
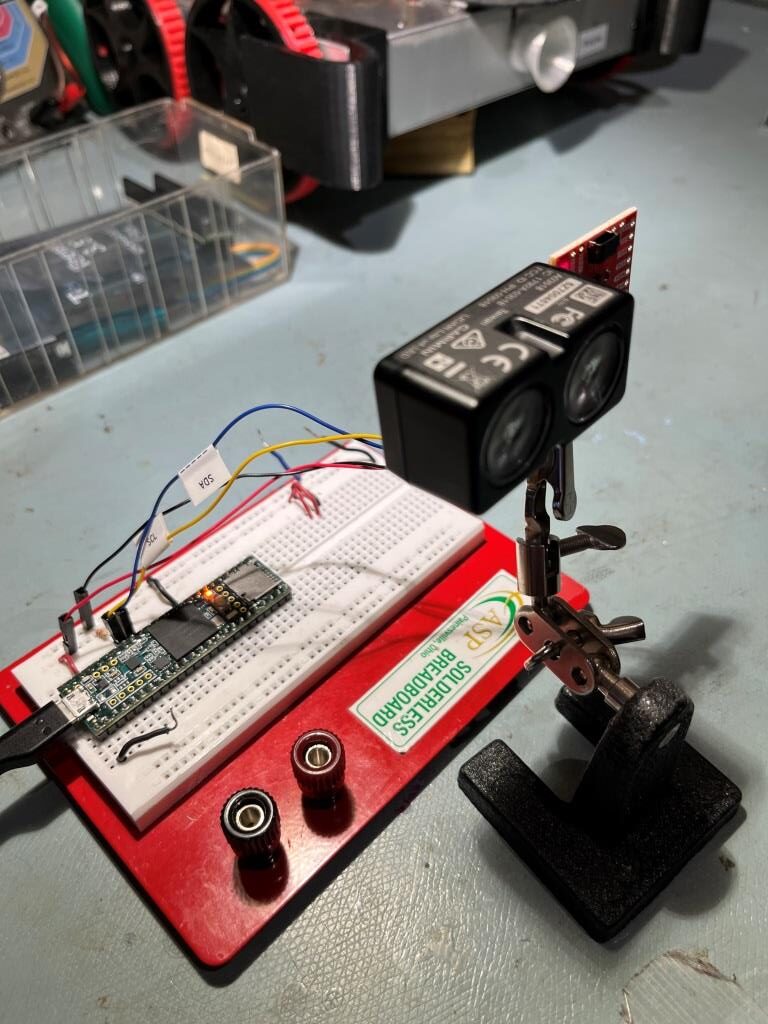
The first thing I did was put together a small test setup using a plug board and a Teensy 3.5, as shown below:
I started off the study by using one of Sparkfun’s ‘Example1_GetDistance’ program, (modified for better print output) as shown below:
|
1 2 3 4 5 6 7 8 9 10 11 12 13 14 15 16 17 18 19 20 21 22 23 24 25 26 27 28 29 30 31 32 33 34 35 36 37 38 39 40 41 42 43 44 45 46 47 48 49 50 51 52 53 54 55 56 57 58 59 60 61 62 63 64 65 66 67 68 69 70 71 72 73 74 |
/* Name: Garmin_LIDARV4_Study.ino Created: 2/16/2023 7:45:05 PM Author: FRANKNEWXPS15\Frank */ /****************************************************************************** Reads the distance something is in front of LIDAR and prints it to the Serial port Priyanka Makin @ SparkX Labs Original Creation Date: Sept 30, 2019 This code is Lemonadeware; if you see me (or any other SparkFun employee) at the local, and you've found our code helpful, please buy us a round! Hardware Connections: Plug Qwiic LIDAR into Qwiic RedBoard using Qwiic cable. Set serial monitor to 115200 baud. Distributed as-is; no warranty is given. ******************************************************************************/ #include "LIDARLite_v4LED.h" LIDARLite_v4LED myLIDAR; //Click here to get the library: http://librarymanager/All#SparkFun_LIDARLitev4 by SparkFun float newDistance; void setup() { Serial.begin(115200); Serial.println("Qwiic LIDARLite_v4 examples"); Wire.begin(); //Join I2C bus //check if LIDAR will acknowledge over I2C if (myLIDAR.begin() == false) { Serial.println("Device did not acknowledge! Freezing."); while (1); } Serial.println("LIDAR acknowledged!"); //gfp added pinMode(LED_BUILTIN, OUTPUT); digitalWrite(LED_BUILTIN, LOW); Serial.printf("Msec\tDistCm\n"); } void loop() { //getDistance() returns the distance reading in cm digitalToggle(LED_BUILTIN); newDistance = myLIDAR.getDistance(); digitalToggle(LED_BUILTIN); //Print to Serial port //Serial.print("New distance: "); //Serial.print(newDistance / 100); //Serial.println(" m"); Serial.printf("%lu\t%2.3f\n",millis(), newDistance); //delay(20); //Don't hammer too hard on the I2C bus //delay(200); //Don't hammer too hard on the I2C bus } //void setup() //{ // Serial.begin(115200); // Serial.printf("Hello World\n"); //} //void loop() //{} |
When I ran this program, I noticed that regardless of the delay value in loop(), the time stamps associated with successive distance measurement were a LOT further apart than I expected. So, I fiddled around with the experiment and soon discovered that the time between subsequent measurements varied dramatically depending on the actual distance being measured; short distances were measured very quickly, long distances not so much. In a way this makes a lot of sense (it is a ‘time-of-flight’ device after all), but since we are talking about the speed of light – i.e. 3*10^8 m/sec, it seems a little unreasonable for a measurement of something like 4 m to take significantly longer than for a measurement of 1m, don’t you think?
In any case, I set up an experiment where I pointed the unit at a distant (i.e. 4m) target, and then waved my hand in front of the LIDAR to simulate a close target, and had the program print out the time stamp and the distance measurement. I dumped this into Excel, and plotted the measured distance along with the time difference between subsequent measurements, and got the following plot:
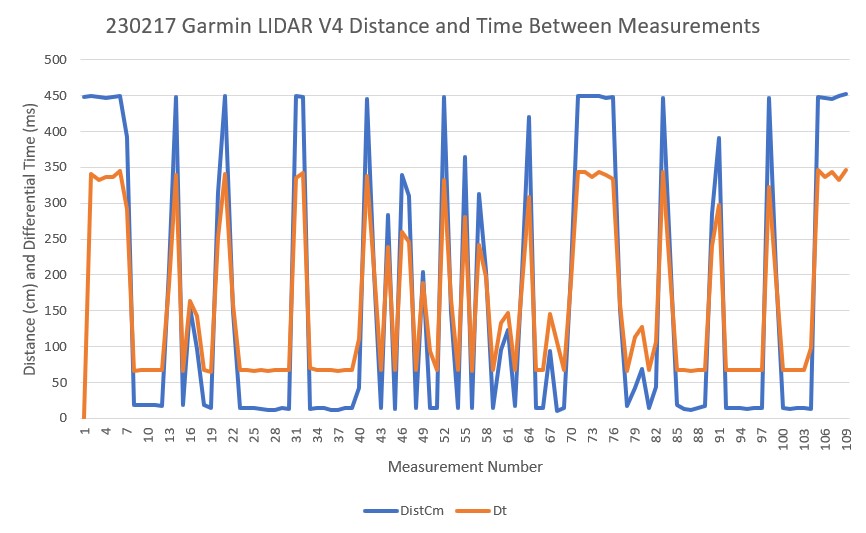
As can be seen in the above plot the time required between two measurements at a distance of 450cm is approximately 350mSec – ouch! Conversely, the time required between two measurements at a distance of 20cm is approximately 70mSec – a factor of five – wow!
Looking at the code, it is clear that myLIDAR.getDistance() is a blocking function that first triggers a new measurement, and then waits for the LIDAR to finish before reporting the result. Reading through the Garmin documentation, I learned that Garmin developed an Arduino library for the V4 unit. I loaded this library and ran their ‘v4LED/v4LED_fast’ example. Here’s the code (slightly modified for better printout using a Teensy 3.5):
|
1 2 3 4 5 6 7 8 9 10 11 12 13 14 15 16 17 18 19 20 21 22 23 24 25 26 27 28 29 30 31 32 33 34 35 36 37 38 39 40 41 42 43 44 45 46 47 48 49 50 51 52 53 54 55 56 57 58 59 60 61 62 63 64 65 66 67 68 69 70 71 72 73 74 75 76 77 78 79 80 81 82 83 84 85 86 87 88 89 90 91 92 93 94 95 96 97 98 99 100 101 102 103 104 105 106 107 108 109 110 111 112 113 114 115 116 117 118 119 120 121 122 123 124 125 126 127 128 129 130 131 132 133 134 135 136 137 138 139 140 141 142 143 144 145 146 147 148 149 150 151 152 153 154 155 156 157 158 159 160 161 162 163 164 165 166 167 168 169 170 171 172 173 174 175 176 177 178 179 180 181 182 183 184 185 186 187 188 189 190 191 192 193 194 195 196 197 198 199 200 201 202 203 204 205 206 207 208 209 210 211 212 213 214 215 216 217 218 219 220 221 222 223 224 |
/* Name: Garmin_LIDARV4_Study_V2.ino Created: 2/17/2023 4:34:38 PM Author: FRANKNEWXPS15\Frank 02/17/23 This version uses the 'v4LED/v4LED_fast' example program from the Garmin library */ /*------------------------------------------------------------------------------ LIDARLite Arduino Library v4LED/v4LED_fast This example shows how to take multiple distance measurements with a LIDAR-Lite v4 LED with a high rep rate using the optional GPIO pins or the I2C port to trigger measurements. *** NOTE *** The LIDAR-Lite v4 LED is strictly a 3.3V system. The Arduino Due is a 3.3V system and is recommended for use with the LIDAR-Lite v4 LED. Care MUST be taken if connecting to a 5V system such as the Arduino Uno. See comment block in the setup() function for details on I2C connections. It is recommended to use a voltage level-shifter if connecting the GPIO pins to any 5V system I/O. Connections: LIDAR-Lite 5 VDC (pin 1) to Arduino 5V LIDAR-Lite Ground (pin 2) to Arduino GND LIDAR-Lite I2C SDA (pin 3) to Arduino SDA LIDAR-Lite I2C SCL (pin 4) to Arduino SCL Optional connections to utilize GPIO triggering: LIDAR-Lite GPIOA (pin 5) to Arduino Digital 2 LIDAR-Lite GPIOB (pin 6) to Arduino Digital 3 (Capacitor recommended to mitigate inrush current when device is enabled) 680uF capacitor (+) to Arduino 5V 680uF capacitor (-) to Arduino GND See the Operation Manual for wiring diagrams and more information ------------------------------------------------------------------------------*/ #include <stdint.h> #include <Wire.h> #include "LIDARLite_v4LED.h" LIDARLite_v4LED myLidarLite; #define FAST_I2C #define MonitorPin 3 #define TriggerPin 2 uint32_t old_timeMSec;//02/17/23 gfp - added to print out differential measurement time //--------------------------------------------------------------------- void setup() //--------------------------------------------------------------------- { // Initialize Arduino serial port (for display of ASCII output to PC) Serial.begin(115200); // Initialize Arduino I2C (for communication to LidarLite) Wire.begin(); #ifdef FAST_I2C #if ARDUINO >= 157 Wire.setClock(400000UL); // Set I2C frequency to 400kHz (for Arduino Due) #else TWBR = ((F_CPU / 400000UL) - 16) / 2; // Set I2C frequency to 400kHz #endif #endif // ---------------------------------------------------------------------- // The LIDAR-Lite v4 LED is strictly a 3.3V system. The Arduino Due is a // 3.3V system and is recommended for use with the LIDAR-Lite v4 LED. // Care MUST be taken if connecting to a 5V system such as the Arduino Uno. // // I2C is a two wire communications bus that requires a pull-up resistor // on each signal. In the Arduino microcontrollers the Wire.begin() // function (called above) turns on pull-up resistors that pull the I2C // signals up to the system voltage rail. The Arduino Uno is a 5V system // and using the Uno's internal pull-ups risks damage to the LLv4. // // The two digitalWrite() functions (below) turn off the micro's internal // pull-up resistors. This protects the LLv4 from damage via overvoltage // but requires external pullups to 3.3V for the I2C signals. // // External pull-ups are NOT present on the Arduino Uno and must be added // manually to the I2C signals. 3.3V is available on pin 2 of the 6pin // "POWER" connector and can be used for this purpose. See the Uno // schematic for details: // https://www.arduino.cc/en/uploads/Main/arduino-uno-schematic.pdf // // External 1.5k ohm pull-ups to 3.3V are already present on the // Arduino Due. If using the Due no further action is required // ---------------------------------------------------------------------- digitalWrite(SCL, LOW); digitalWrite(SDA, LOW); // ---------------------------------------------------------------------- // Optional GPIO pin assignments for measurement triggering & monitoring // ---------------------------------------------------------------------- pinMode(MonitorPin, INPUT); pinMode(TriggerPin, OUTPUT); digitalWrite(TriggerPin, LOW); // ---------------------------------------------------------------------- // Optionally configure the LidarLite parameters to lend itself to // various modes of operation by altering 'configure' input integer. // See LIDARLite_v4LED.cpp for details. // ---------------------------------------------------------------------- myLidarLite.configure(0); // ---------------------------------------------------------------------- // ** One method of increasing the measurement speed of the // LIDAR-Lite v4 LED is to adjust the number of acquisitions taken // per measurement from the default of 20. For max speed we // set this value to 0x00 in this example. // ** Note that when reducing the number of acquisitions taken per // measurement from the default, repeatability of measurements is // reduced. // ---------------------------------------------------------------------- uint8_t dataByte = 0x00; myLidarLite.write(0xEB, &dataByte, 1, 0x62); // Turn off high accuracy mode //02/17/23 gfp old_timeMSec = millis(); Serial.printf("MSec\tDist\tDt\n"); } //--------------------------------------------------------------------- void loop() //--------------------------------------------------------------------- { // Using GPIO triggering can increase the rep rate. // Remove comments from the line below to use I2C triggering. #define USE_I2C_TRIGGERING uint16_t distance; uint8_t newDistance; //bool newDistance; //02/17/23 gfp - used like a boolean, so make it one! #ifdef USE_I2C_TRIGGERING newDistance = distanceContinuous(&distance); #else newDistance = distanceContinuousGpio(&distance); #endif if (newDistance) { uint32_t curtimeMsec = millis(); //Serial.println(distance); // print measurement to serial terminal Serial.printf("%lu\t%d\t%d\n", curtimeMsec, distance, curtimeMsec -old_timeMSec); // print measurement to serial terminal old_timeMSec = curtimeMsec; } } //--------------------------------------------------------------------- // Read Continuous Distance Measurements // // The most recent distance measurement can always be read from // device registers. Polling for the BUSY flag in the STATUS // register can alert the user that the distance measurement is new // and that the next measurement can be initiated. If the device is // BUSY this function does nothing and returns 0. If the device is // NOT BUSY this function triggers the next measurement, reads the // distance data from the previous measurement, and returns 1. //--------------------------------------------------------------------- uint8_t distanceContinuous(uint16_t* distance) { uint8_t newDistance = 0; // Check on busyFlag to indicate if device is idle // (meaning = it finished the previously triggered measurement) if (myLidarLite.getBusyFlag() == 0) { // Trigger the next range measurement myLidarLite.takeRange(); // Read new distance data from device registers *distance = myLidarLite.readDistance(); // Report to calling function that we have new data newDistance = 1; } return newDistance; } //--------------------------------------------------------------------- // Read Continuous Distance Measurements using Trigger / Monitor Pins // // The most recent distance measurement can always be read from // device registers. Polling for the BUSY flag using the Monitor Pin // can alert the user that the distance measurement is new // and that the next measurement can be initiated. If the device is // BUSY this function does nothing and returns 0. If the device is // NOT BUSY this function triggers the next measurement, reads the // distance data from the previous measurement, and returns 1. //--------------------------------------------------------------------- uint8_t distanceContinuousGpio(uint16_t* distance) { uint8_t newDistance = 0; // Check on busyFlag to indicate if device is idle // (meaning = it finished the previously triggered measurement) if (myLidarLite.getBusyFlagGpio(MonitorPin) == 0) { // Trigger the next range measurement myLidarLite.takeRangeGpio(TriggerPin, MonitorPin); // Read new distance data from device registers *distance = myLidarLite.readDistance(); // Report to calling function that we have new data newDistance = 1; } return newDistance; } |
NOTE: the ‘fast’ example sets the number of acquisitions per measurement from the default value of 20 to 0, as shown in the following code snippet from the bottom of setup():
|
1 2 3 4 5 6 7 8 9 10 11 |
// ---------------------------------------------------------------------- // ** One method of increasing the measurement speed of the // LIDAR-Lite v4 LED is to adjust the number of acquisitions taken // per measurement from the default of 20. For max speed we // set this value to 0x00 in this example. // ** Note that when reducing the number of acquisitions taken per // measurement from the default, repeatability of measurements is // reduced. // ---------------------------------------------------------------------- uint8_t dataByte = 0x00; myLidarLite.write(0xEB, &dataByte, 1, 0x62); // Turn off high accuracy mode |
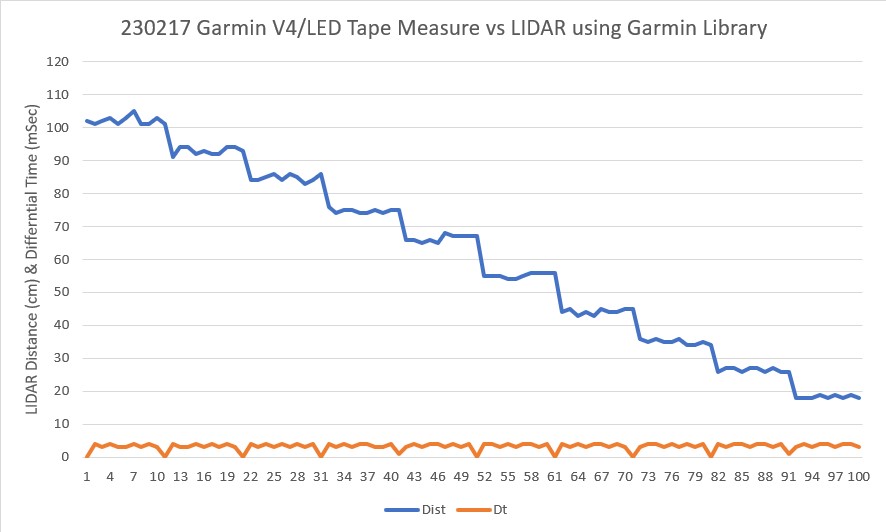
Here’s an Excel plot of the output:
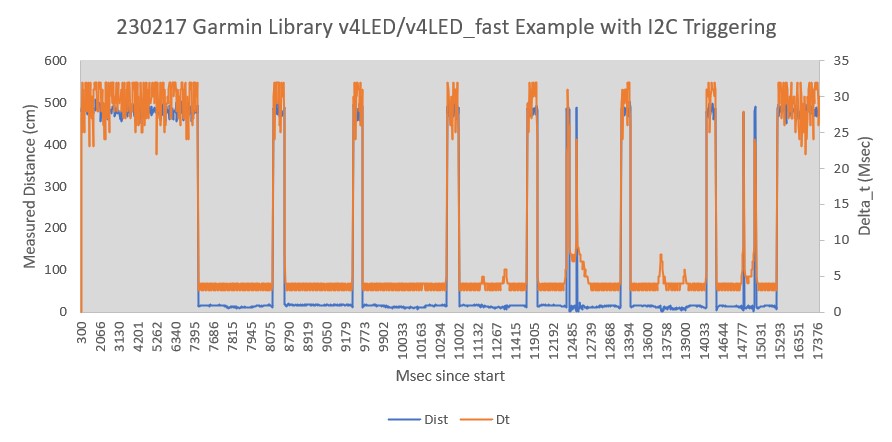
As the above plot shows, this example produces measurements much faster than the first one. Instead of 350mSec at 450cm is approximately, it is about 32Msec – a 10:1 ratio! And instead of approximately 70mSec at a distance of 20cm, it is more like 2Msec – again a 10:1 ratio.
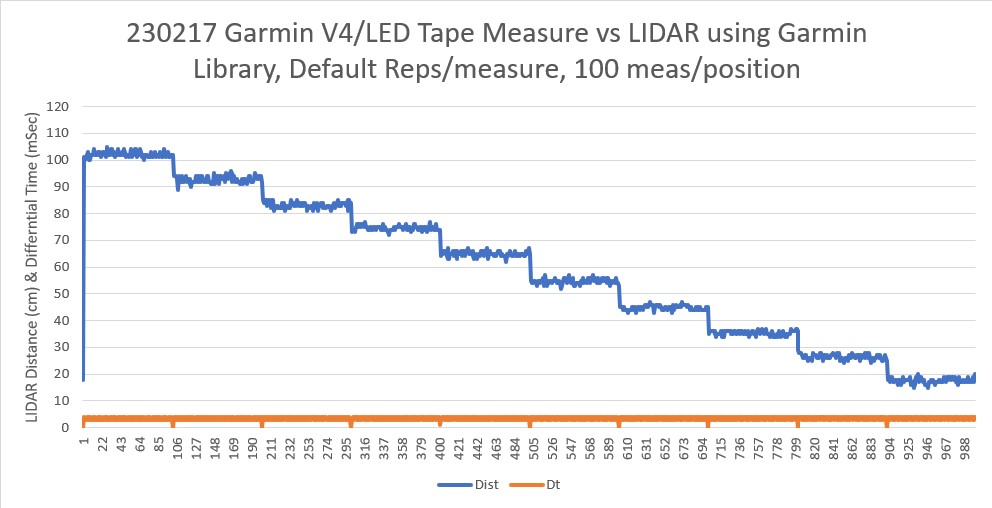
To address the issue of accuracy and repeatability, I used a tape measure to set up a target 100cm away as shown in the following photo, and then moved the LIDAR in 10cm increments toward the target, taking 10 measurements at each stop.
As the above plot shows, each measurement is repeatable within +/- 2cm. However, the accuracy seemed to deteriorate as the distance decreased. The error started off at about +1 to +2cm at 100cm, and then increased more or less linearly to +8 to +9cm at 10cm.
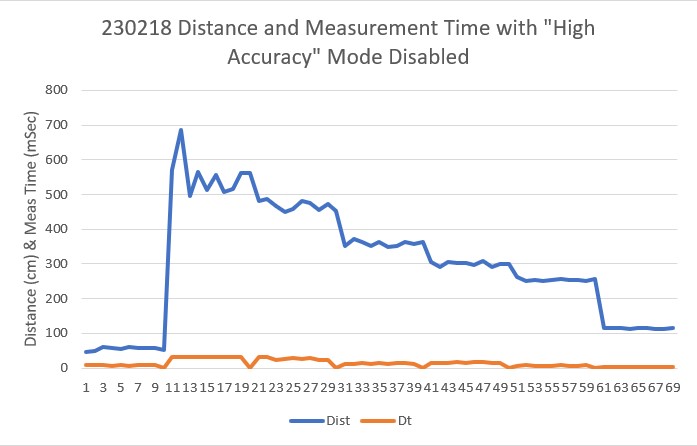
Next, I re-ran the experiment after commenting out the line myLidarLite.write(0xEB, &dataByte, 1, 0x62); // Turn off high accuracy mode that disabled the ‘high accuracy’ mode. However, the results weren’t any better, and actually look worse than before.
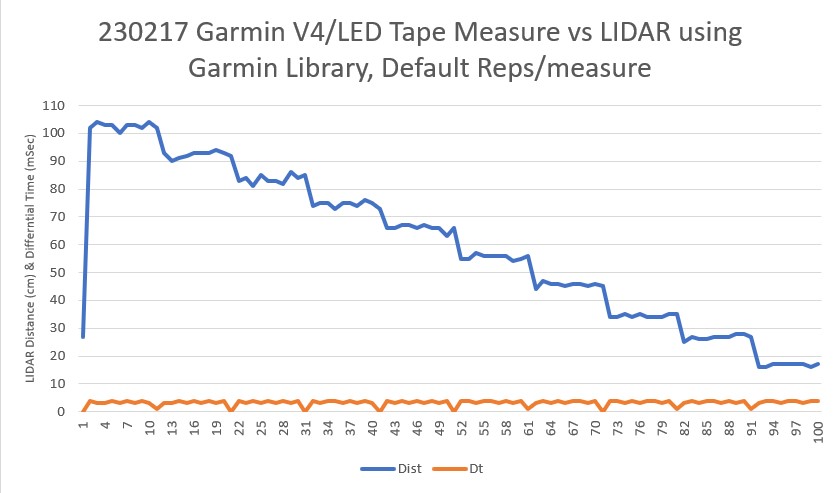
Just for completeness, I ran the experiment again, with the same configuration as the above plot, except with 100 measurements/position instead of 10. As the following plot shows, repeatability is excellent – accuracy ‘not so much’.
18 February 2023 Update:
As I was drifting off to sleep last night, I was thinking about what I had learned from that day’s experiments with the Garmin LIDAR V4/LED unit. Something that popped into my head was an image of the last set of data I took, but the inter-measurement delay was about 65-67mSec – not the 1-2mSec I had been seeing – what caused that?
So, today I redid the distance progression measurement, with the ‘high accuracy’ mode enabled as before (except starting at 150cm rather than 100), with the following results:
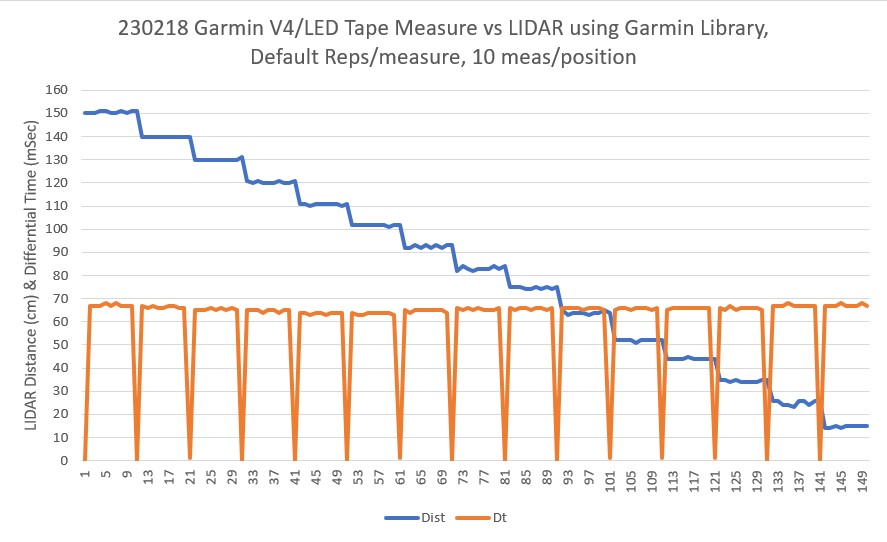
This time the time delay between measurements was about 67mSec – the same as I got with that last measurement from yesterday (the image that got stuck in my head as I was going to sleep). In addition, the distance accuracy seemed to be better – the error at 10cm was about +5cm rather than the +8 – +9cm from yesterday, while the error values above 100cm (1m) were negligible.
Redid the above experiment with the ‘high accuracy’ mode disabled (as it was in the original ‘Fast’ measurement code), with the LIDAR at the last position (10cm) from the previous run, with the following results:
|
1 2 3 4 5 6 7 8 9 10 11 |
MSec Dist Dt 7200 15 0 7204 19 4 7207 18 3 7211 20 4 7215 19 4 7218 19 3 7222 20 4 7226 19 4 7230 20 4 7233 19 3 |
Without changing anything else, and with the LIDAR in the same position, I re-compiled the code to re-enable ‘high accuracy’ mode, and got the following result
|
1 2 3 4 5 6 7 8 9 10 11 |
MSec Dist Dt 4400 19 0 4404 17 4 4407 16 3 4411 17 4 4415 18 4 4418 18 3 4422 19 4 4426 17 4 4429 18 3 4433 18 4 |
Wait a minute! The above results are the same as the ‘fast’ results – what gives? I ran this same test several times, recompiling and re-uploading the code each time – no change! Then I cycled power to the unit and tried again, with the following results:
|
1 2 3 4 5 6 7 8 9 10 |
22900 0 0 22968 15 68 23036 15 68 23103 15 67 23171 14 68 23239 14 68 23307 15 68 23374 14 67 23442 15 68 23510 15 68 |
Aha! Recycling the power did the trick – now the results show the lower error (+5 vs +9cm) and the higher delay between measurements (67-68 vs 2 – 3Msec). So the last two plots from yesterday were performed in the ‘fast’ (low accuracy) mode, even after changing (and re-uploading) the Teensy sketch. Now that I think about it – this makes sense, as the change I made from the ‘fast’ configuration to the ‘high accuracy’ one was to comment out the write to register 0XEB. Because I didn’t cycle power to the Garmin, this left register 0XEB’s contents unchanged – e.g. still in ‘fast’ mode! Oops!!!
This is not the first time (by a LOT!!) that my pre-sleep review of the day’s efforts has paid off. Maybe the lack of outside stimulus allows my brain to sift through conflicting or incomplete data without interference. I wonder if this is one of those hidden talents that comes with “The Knack” 🙂
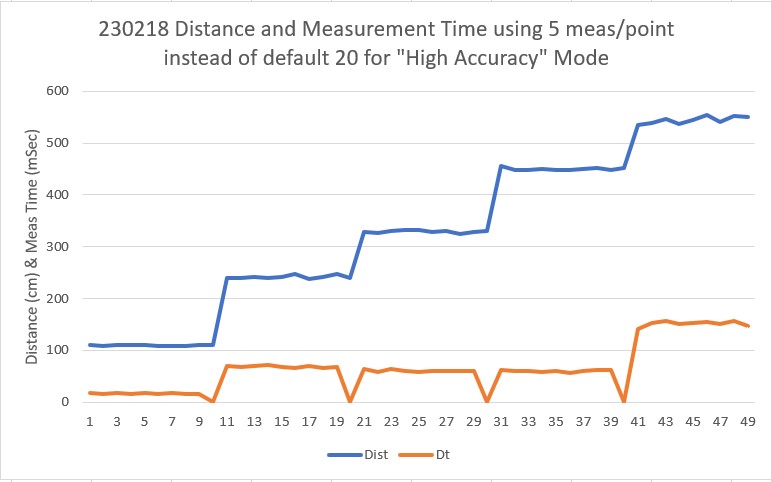
Anyway, now that I have figured out how to get into (and out of) ‘high accuracy’ mode, I re-ran the above experiment (with the unit in ‘high accuracy’ mode) where the LIDAR is aimed at various distances, with the following results:
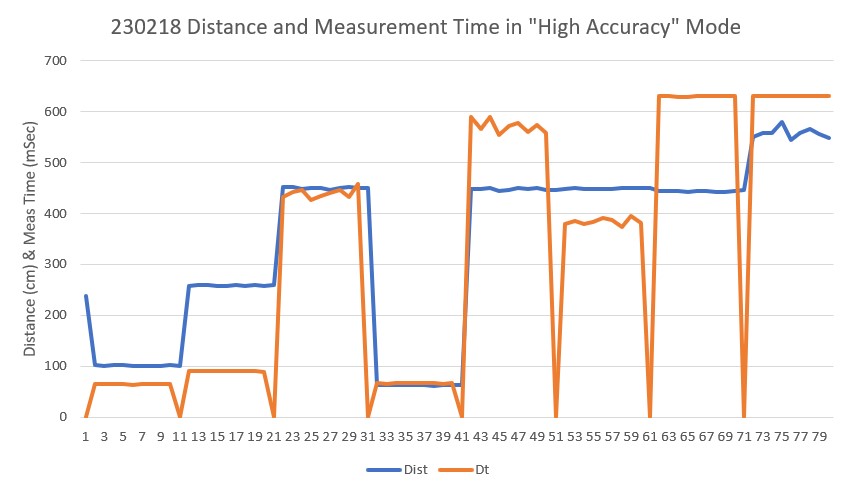
From the above it is clear that the ‘high accuracy’ mode is quite expensive in terms of measurement frequency. In ‘high accuracy’ mode measurements can take 500mSec or more for long ranges, whereas in ‘low accuracy’ mode the same measurement takes less than 50mSec even in the worst case.
Next I tried some different values for the number of measurements/point written to Garmin register 0xEB. With values of 10 (0x0A) and 5 (0x05), I got the following responses for medium to long distances:
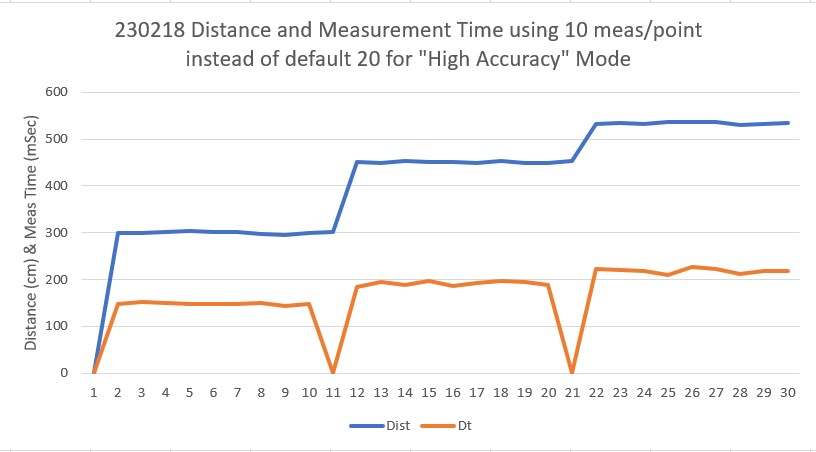
With 5 acquisitions/measurement the measurement time is still well less than 200mSec, and I currently use FRONT_DISTANCE_UPDATE_INTERVAL_MSEC = 250, so this should be compatible with current operations, even at the longest ranges. I’m not really sure why I care all that much about accuracy, as all I’m trying to do is detect either the ‘STUCK_AHEAD’ condition (when the calculated measurement variance goes below a threshold) and the ‘OBSTACLE_AHEAD’ condition (where the measurement falls below a set distance). Neither of these cases requires much in the way of absolute accuracy.
19 February 2023 Update:
I decided to run Garmin’s ‘Low Power’ example, modified for better printout with the Teensy 3.5 as shown below:
|
1 2 3 4 5 6 7 8 9 10 11 12 13 14 15 16 17 18 19 20 21 22 23 24 25 26 27 28 29 30 31 32 33 34 35 36 37 38 39 40 41 42 43 44 45 46 47 48 49 50 51 52 53 54 55 56 57 58 59 60 61 62 63 64 65 66 67 68 69 70 71 72 73 74 75 76 77 78 79 80 81 82 83 84 85 86 87 88 89 90 91 92 93 94 95 96 97 98 99 100 101 102 103 104 105 106 107 108 109 110 111 112 113 114 115 116 117 118 119 120 121 122 123 124 125 126 127 128 129 130 131 132 133 134 135 136 137 138 139 140 141 142 143 144 145 146 147 148 149 150 151 152 153 154 155 156 157 158 159 160 161 |
/* Name: Garmin_LIDARV4_LOW_POWER.ino Created: 2/19/2023 12:52:32 PM Author: FRANKNEWXPS15\Frank */ /*------------------------------------------------------------------------------ LIDARLite Arduino Library v4LED/v4LED_lowpower This example shows how to take single distance measurements with a LIDAR-Lite v4 LED using only the I2C port in a lower power state. *** NOTE *** The LIDAR-Lite v4 LED is strictly a 3.3V system. The Arduino Due is a 3.3V system and is recommended for use with the LIDAR-Lite v4 LED. Care MUST be taken if connecting to a 5V system such as the Arduino Uno. See comment block in the setup() function for details on I2C connections. It is recommended to use a voltage level-shifter if connecting the GPIO pins to any 5V system I/O. Connections: LIDAR-Lite 5 VDC (pin 1) to Arduino 5V LIDAR-Lite Ground (pin 2) to Arduino GND LIDAR-Lite I2C SDA (pin 3) to Arduino SDA LIDAR-Lite I2C SCL (pin 4) to Arduino SCL Optional connections to utilize GPIO triggering: LIDAR-Lite GPIOA (pin 5) to Arduino Digital 2 LIDAR-Lite GPIOB (pin 6) to Arduino Digital 3 (Capacitor recommended to mitigate inrush current when device is enabled) 680uF capacitor (+) to Arduino 5V 680uF capacitor (-) to Arduino GND See the Operation Manual for wiring diagrams and more information ------------------------------------------------------------------------------*/ #include <stdint.h> #include <Wire.h> #include "LIDARLite_v4LED.h" LIDARLite_v4LED myLidarLite; #define FAST_I2C #define MonitorPin 3 #define TriggerPin 2 //--------------------------------------------------------------------- void setup() //--------------------------------------------------------------------- { // Initialize Arduino serial port (for display of ASCII output to PC) Serial.begin(115200); // Initialize Arduino I2C (for communication to LidarLite) Wire.begin(); #ifdef FAST_I2C #if ARDUINO >= 157 Wire.setClock(400000UL); // Set I2C frequency to 400kHz (for Arduino Due) #else TWBR = ((F_CPU / 400000UL) - 16) / 2; // Set I2C frequency to 400kHz #endif #endif // ---------------------------------------------------------------------- // The LIDAR-Lite v4 LED is strictly a 3.3V system. The Arduino Due is a // 3.3V system and is recommended for use with the LIDAR-Lite v4 LED. // Care MUST be taken if connecting to a 5V system such as the Arduino Uno. // // I2C is a two wire communications bus that requires a pull-up resistor // on each signal. In the Arduino microcontrollers the Wire.begin() // function (called above) turns on pull-up resistors that pull the I2C // signals up to the system voltage rail. The Arduino Uno is a 5V system // and using the Uno's internal pull-ups risks damage to the LLv4. // // The two digitalWrite() functions (below) turn off the micro's internal // pull-up resistors. This protects the LLv4 from damage via overvoltage // but requires external pullups to 3.3V for the I2C signals. // // External pull-ups are NOT present on the Arduino Uno and must be added // manually to the I2C signals. 3.3V is available on pin 2 of the 6pin // "POWER" connector and can be used for this purpose. See the Uno // schematic for details: // https://www.arduino.cc/en/uploads/Main/arduino-uno-schematic.pdf // // External 1.5k ohm pull-ups to 3.3V are already present on the // Arduino Due. If using the Due no further action is required // ---------------------------------------------------------------------- digitalWrite(SCL, LOW); digitalWrite(SDA, LOW); // ---------------------------------------------------------------------- // Optional GPIO pin assignments for measurement triggering & monitoring // ---------------------------------------------------------------------- pinMode(MonitorPin, INPUT); pinMode(TriggerPin, OUTPUT); digitalWrite(TriggerPin, LOW); // ---------------------------------------------------------------------- // Optionally configure the LidarLite parameters to lend itself to // various modes of operation by altering 'configure' input integer. // See LIDARLite_v4LED.cpp for details. // ---------------------------------------------------------------------- myLidarLite.configure(0); // ---------------------------------------------------------------------- // ** To utilize the low power capabilities of the LIDAR-Lite v4 LED, // turn off high accuracy mode and then switch on asynchronous mode. // ** Note that when defeating high accuracy mode, repeatability // of measurements is reduced. // ** Note that while in asynchronous mode, minimum time between // measurements is 100 milliseconds. // ---------------------------------------------------------------------- uint8_t dataByte = 0x00; myLidarLite.write(0xEB, &dataByte, 1, 0x62); // Turn off high accuracy mode myLidarLite.write(0xE2, &dataByte, 1, 0x62); // Turn on asynchronous mode Serial.printf("Msec\tDistCm\n"); //02/19/23 gfp } //--------------------------------------------------------------------- void loop() //--------------------------------------------------------------------- { uint16_t distance; distanceSingle(&distance); // take a single distance measurement Serial.printf("%lu\t%d\n", millis(),distance); //02/19/23 gfp //Serial.println(distance); // print measurement to serial terminal //delay(250); // wait around for a bit //delay(150); // wait around for a bit delay(100); // wait around for a bit } //--------------------------------------------------------------------- // Read Single Distance Measurement // // This is the simplest form of taking a measurement. This is a // blocking function as it will not return until a range has been // taken and a new distance measurement can be read. //--------------------------------------------------------------------- uint8_t distanceSingle(uint16_t* distance) { // 1. Trigger range measurement. myLidarLite.takeRange(); // 2. Wait for busyFlag to indicate device is idle. myLidarLite.waitForBusy(); // 3. Read new distance data from device registers *distance = myLidarLite.readDistance(); return 1; } |
I modified the above to change the inter-measurement delay to 100mSec vs 250Msec, and pointed the LIDAR at various places around (and outside of) the room. Here’s an Excel plot of the results:
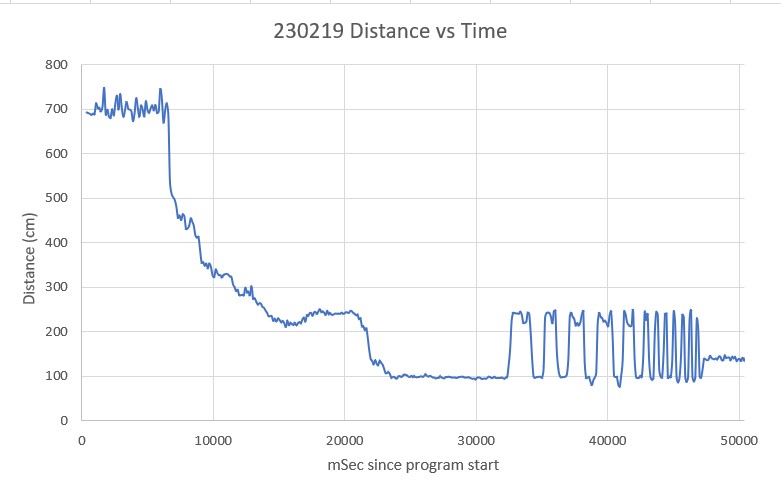
As shown, the LIDAR can measure out to at least 7m with a delay time of 100mSec. This right away is a big win, as the Pulsed Light LIDAR needs about 250mSec to measure out to 4m. The rapid fluctuations from about 100cm to about 250cm were caused by me rapidly moving the LIDAR back and forth between targets at these distances. Here’s an enlargement of this area:
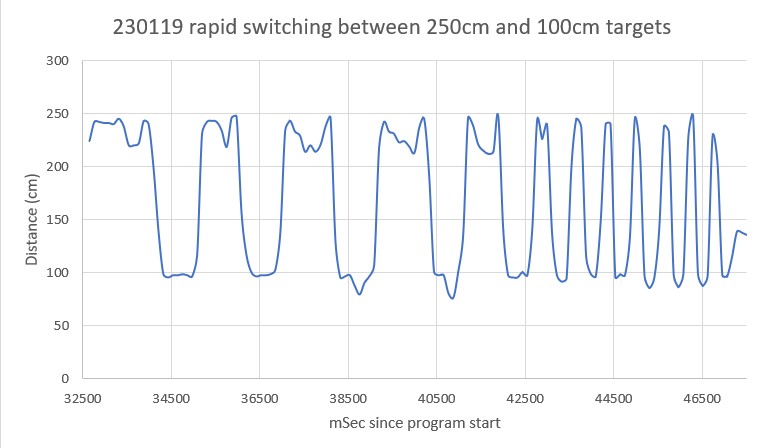
As can be seen in the above enlargement, the LIDAR has no problem following my physical switching between the 100cm & 250cm targets. For the last 7-8 cycles I sped up the switching to see if the Garmin could still follow, and it still did OK. Between 44500 and 46500 (2 sec) there were three cycles, showing that the LIDAR could follow a 250-100cm switching period of about 0.66 sec. This is much faster than WallE3 would need, so this is great!
Current Draw:
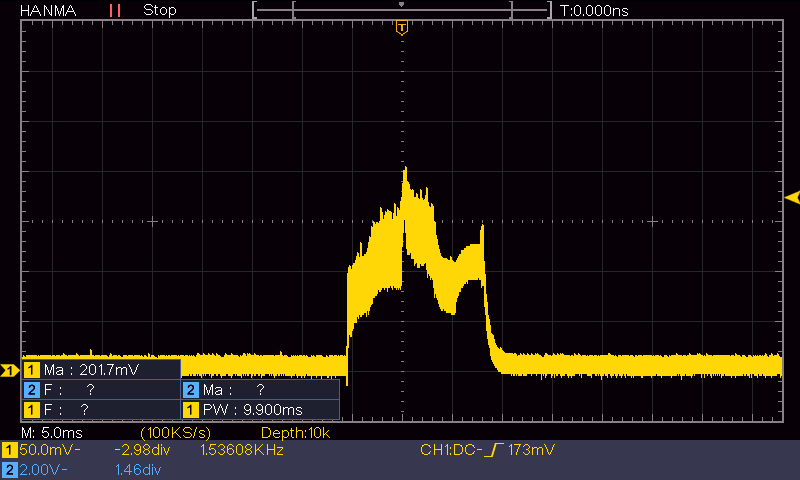
The Garmin Operation Manual and Technical Specifications document shows a current drain of 2mA in idle and 85mA during an acquisition. This might well be true when measured with a typical DVM, but the actual current drain is a lot more complicated than that. Here’s a screen grab from my Hanmatek DOS1102 connected to an Adafruit 1NA169 high-side current monitor, configured for 1V/Amp output.
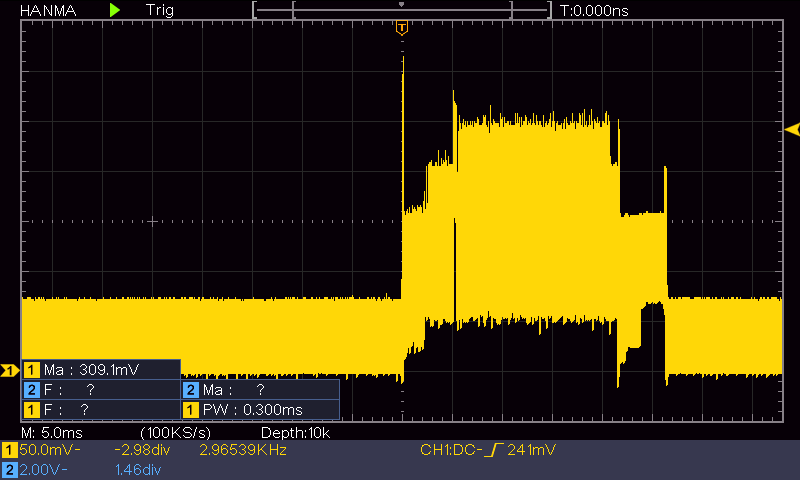
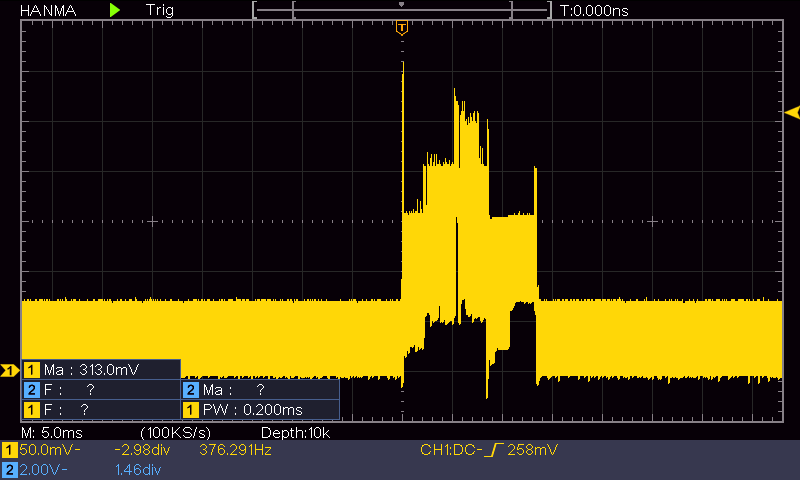
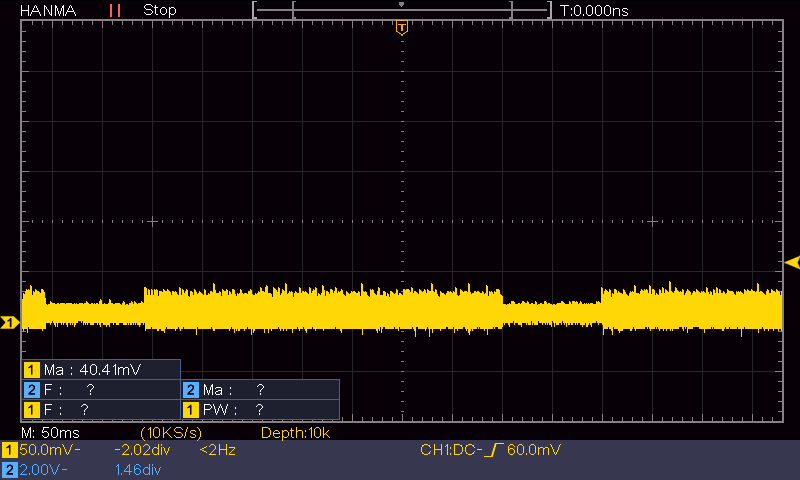
The maximum output for both cases is about 300mV, corresponding to an instantaneous current drain of about 300mA, while the ‘idle’ current between measurements is about 75mA. However, the duty cycle of these waveforms is quite low, as shown in the next set of screengrabs:
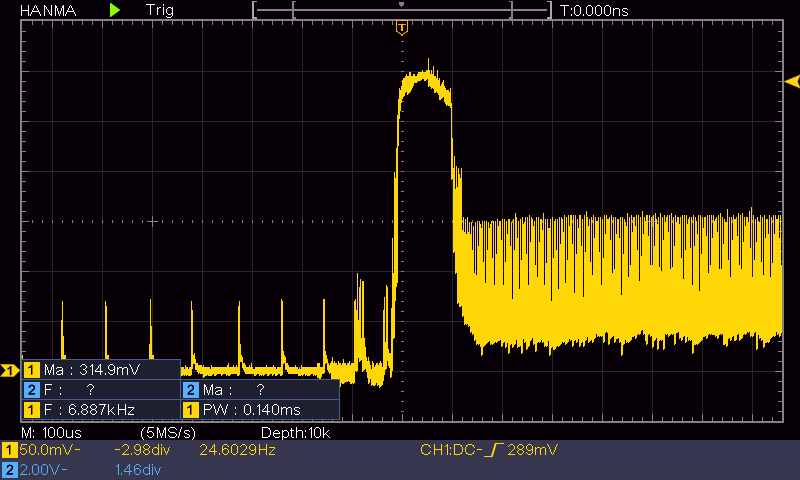
As can be seen, the ‘idle’ current is quite low, due to low duty cycle. The ‘acquisition’ current peaks briefly at 300mA and then drops to about 150mA peak, but again this is at a fairly low duty cycle, as shown in the following screengrab
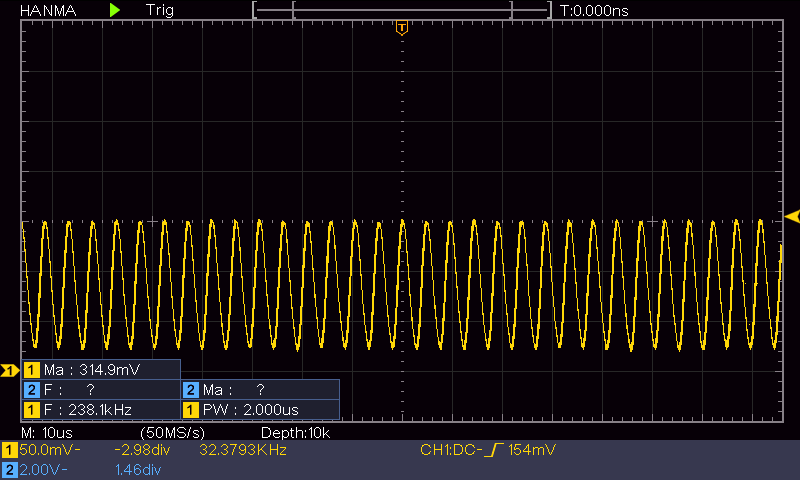
This looks like a 238KHz sine wave, but it could be hitting the top end on my ‘scope’. In any case, the average current drain during this period would be something like 75-100mA, which is pretty close to the advertised 85mA ‘acquisition current’.
20 February 2023 Update:
I believe I read somewhere in the docs about placing a smoothing capacitor on the +3.3V line to the Garmin LIDAR, so I did that – placing a 680uF cap on the LIDAR side of the 1NA169 current monitor to see if that smoothed out some of the current pulses. The following plot shows the situation for a far (~6m) target:
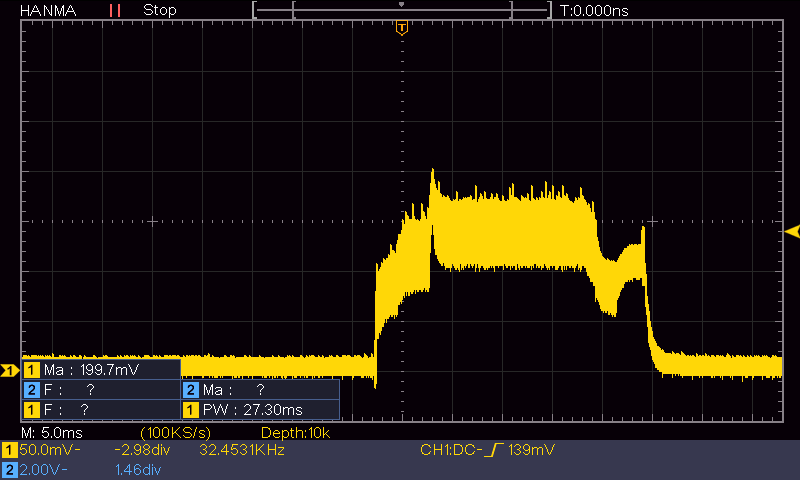
Now the ‘idle’ current is much lower – estimating by eyeball it’s about 25mA, and the acquisition pulse is around 150-250mA. The ‘idle’ waveform has a very low duty cycle, which makes the ‘2mA Idle Current’ figure pretty believable. However, the acquisition current – at least with my unit, appears to be well over 100mA. Here’s the current waveform for a near target (~0.6m)
Interestingly, the measurement time required for the ‘close’ target is about 15mSec, while the time for the ‘far’ target is about 30mSec – a 2:1 ratio, even though he distances themselves are 10:1. In any case, the addition of the capacitor does ‘smooth’ the current waveform considerably, but I would never have noticed any difference if I hadn’t used a current monitor like the 1NA169 .
23 February 2023 Update:
I just now have received a second Garmin LIDAR-Lite V4/LED directly from Garmin, because I wanted a unit without the Sparkfun ‘Qwiic’ breakout board. As part of the project to integrate this new unit into WallE3, I fired up this new device in my little Teensy test circuit. It worked fine, but I noticed a dramatic difference in the current waveform, as reported by the 1NA169 current monitor. The current drain is much lower than the first one I tested. Here’s a screengrab of the current waveform for the new Garmin unit.
I guess the take-away from the above results is that the Sparkfun breakout board may be distorting the results from before.
Stay tuned,
Frank