/*
Name: TeensyLowPowerDigitalScale.ino
Created: 12/2/2018 9:43:43 PM
Author: FRANKWIN10\Frank
*/
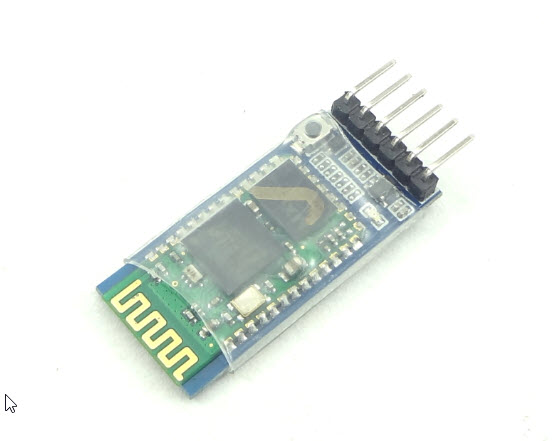
//12/27/18 Added bluetooth support via Serial1
//12/27/18 Added calibration code from TeensyDigitalCalibration.ino
/*
Name: DigitalScaleAutoCal.ino
Created: 11/15/2018 4:49:12 PM
Author: FRANKWIN10\Frank
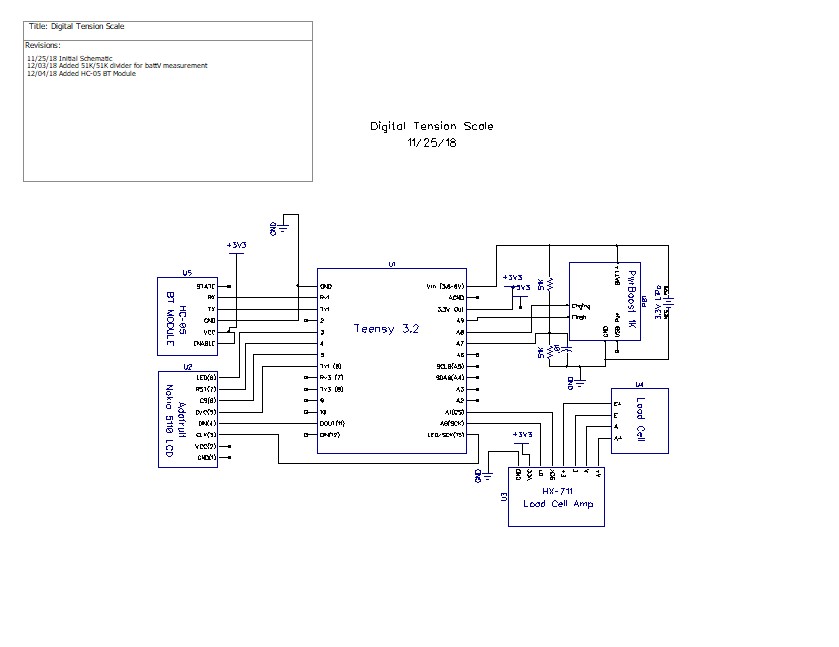
This program is a modification of the November 2016 circuits4you.com program for interfacing
with the HX711 Module coupled with a typical load cell. It's purpose is to automatically
calibrate the combination to accurately display weight in Kg.
The process is as follows:
Step1: User opts to calibrate by entering 'Y' at the prompt. Entering any other key (or
just letting the question time out) will skip the calibration process
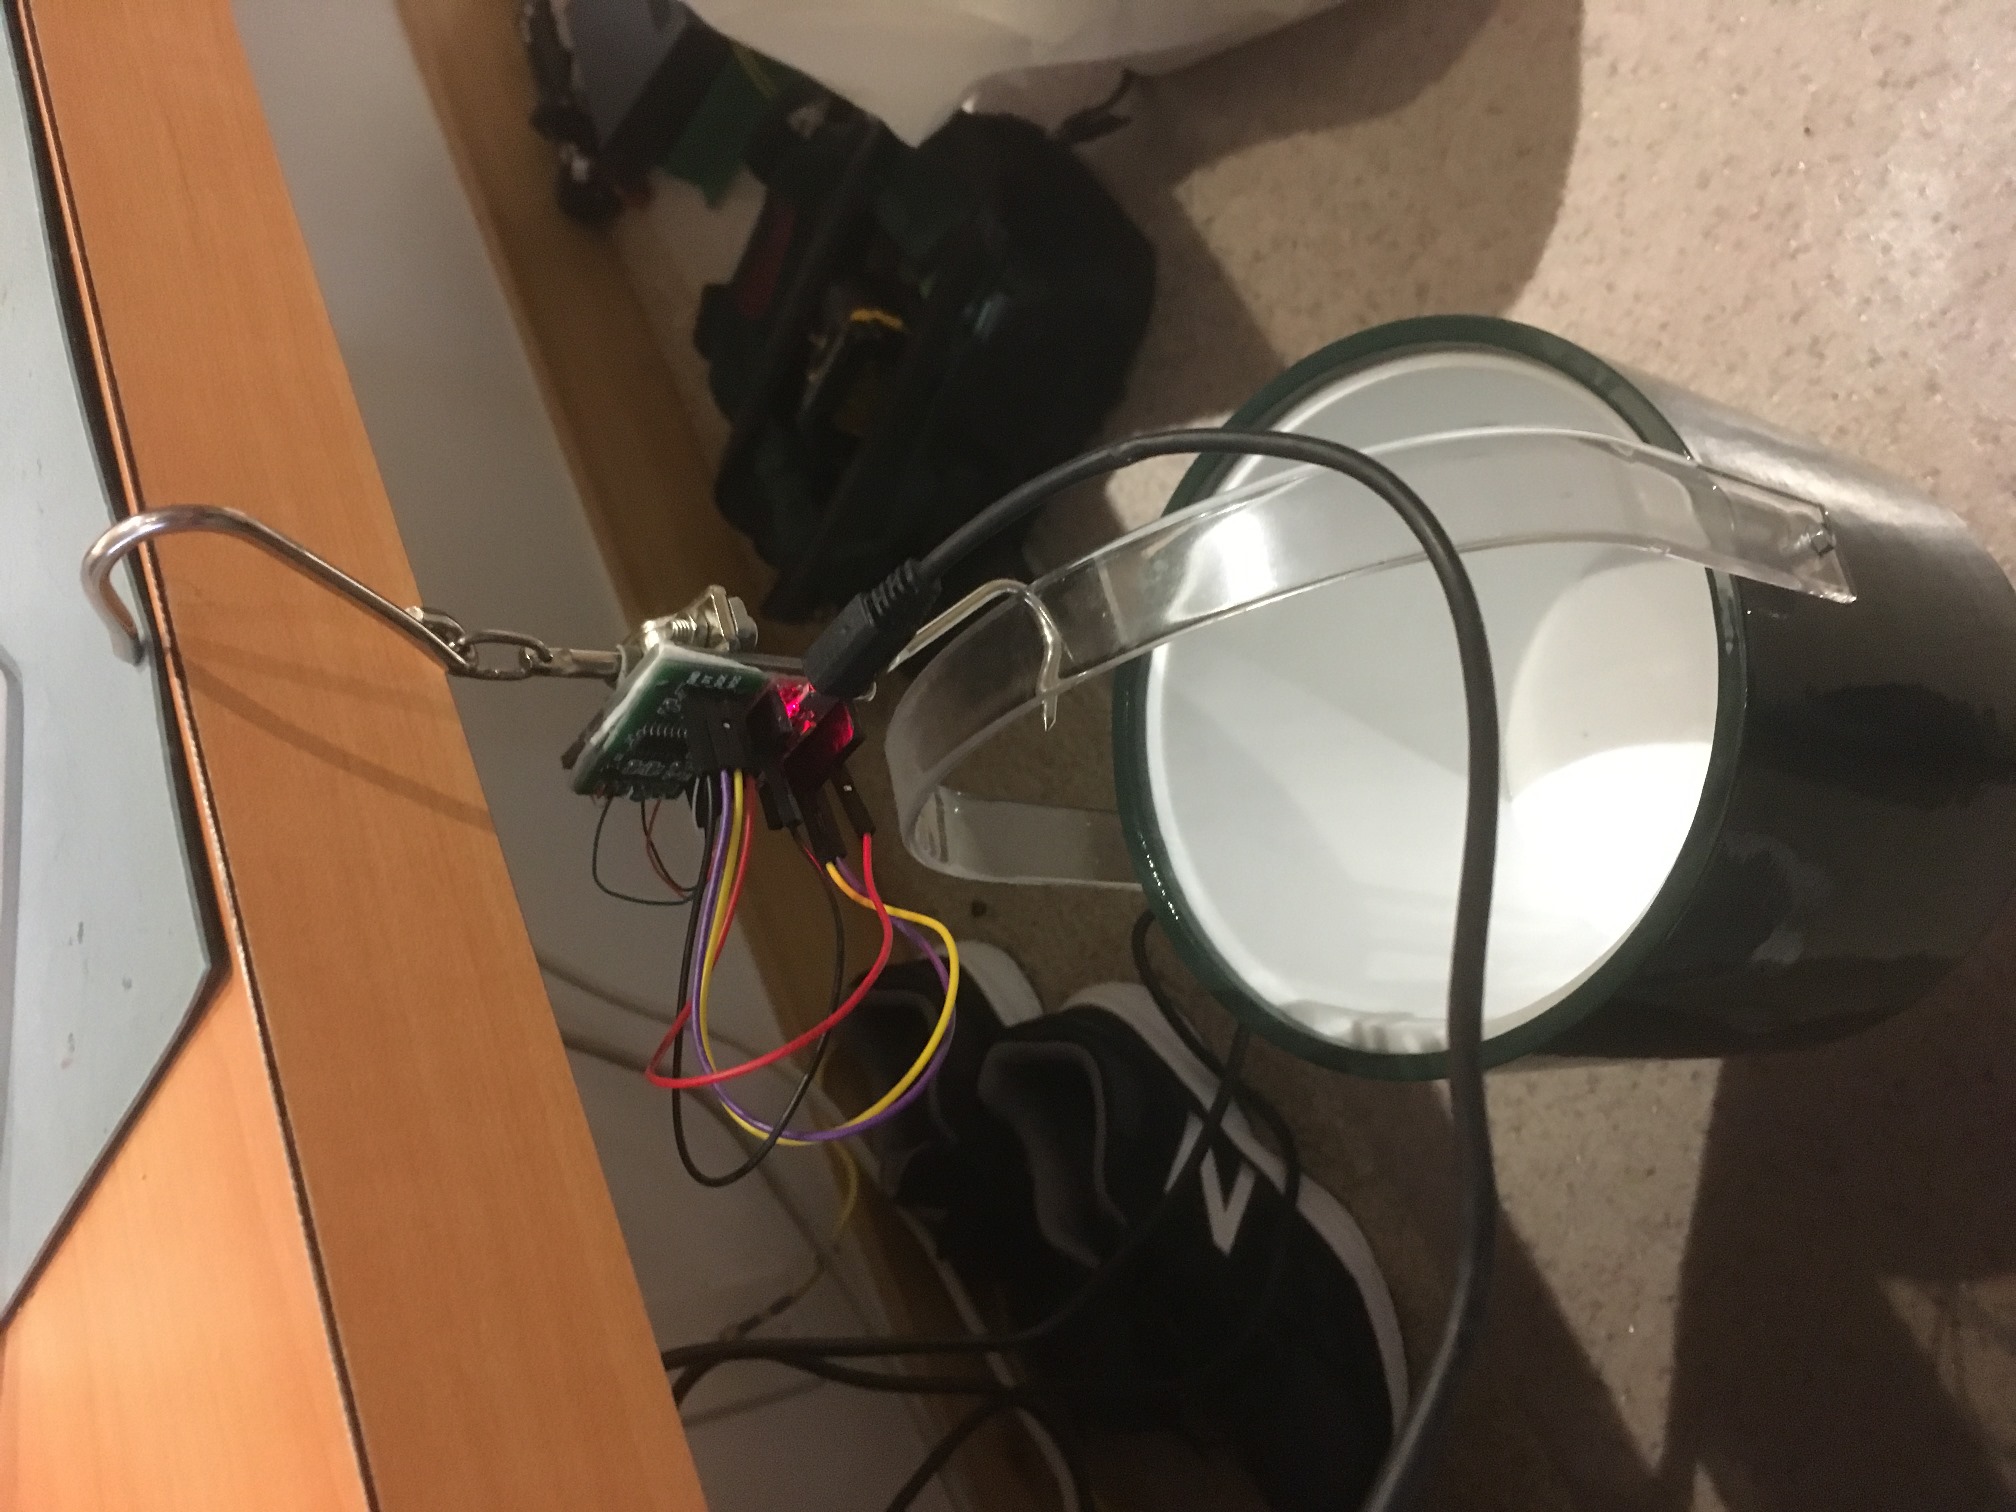
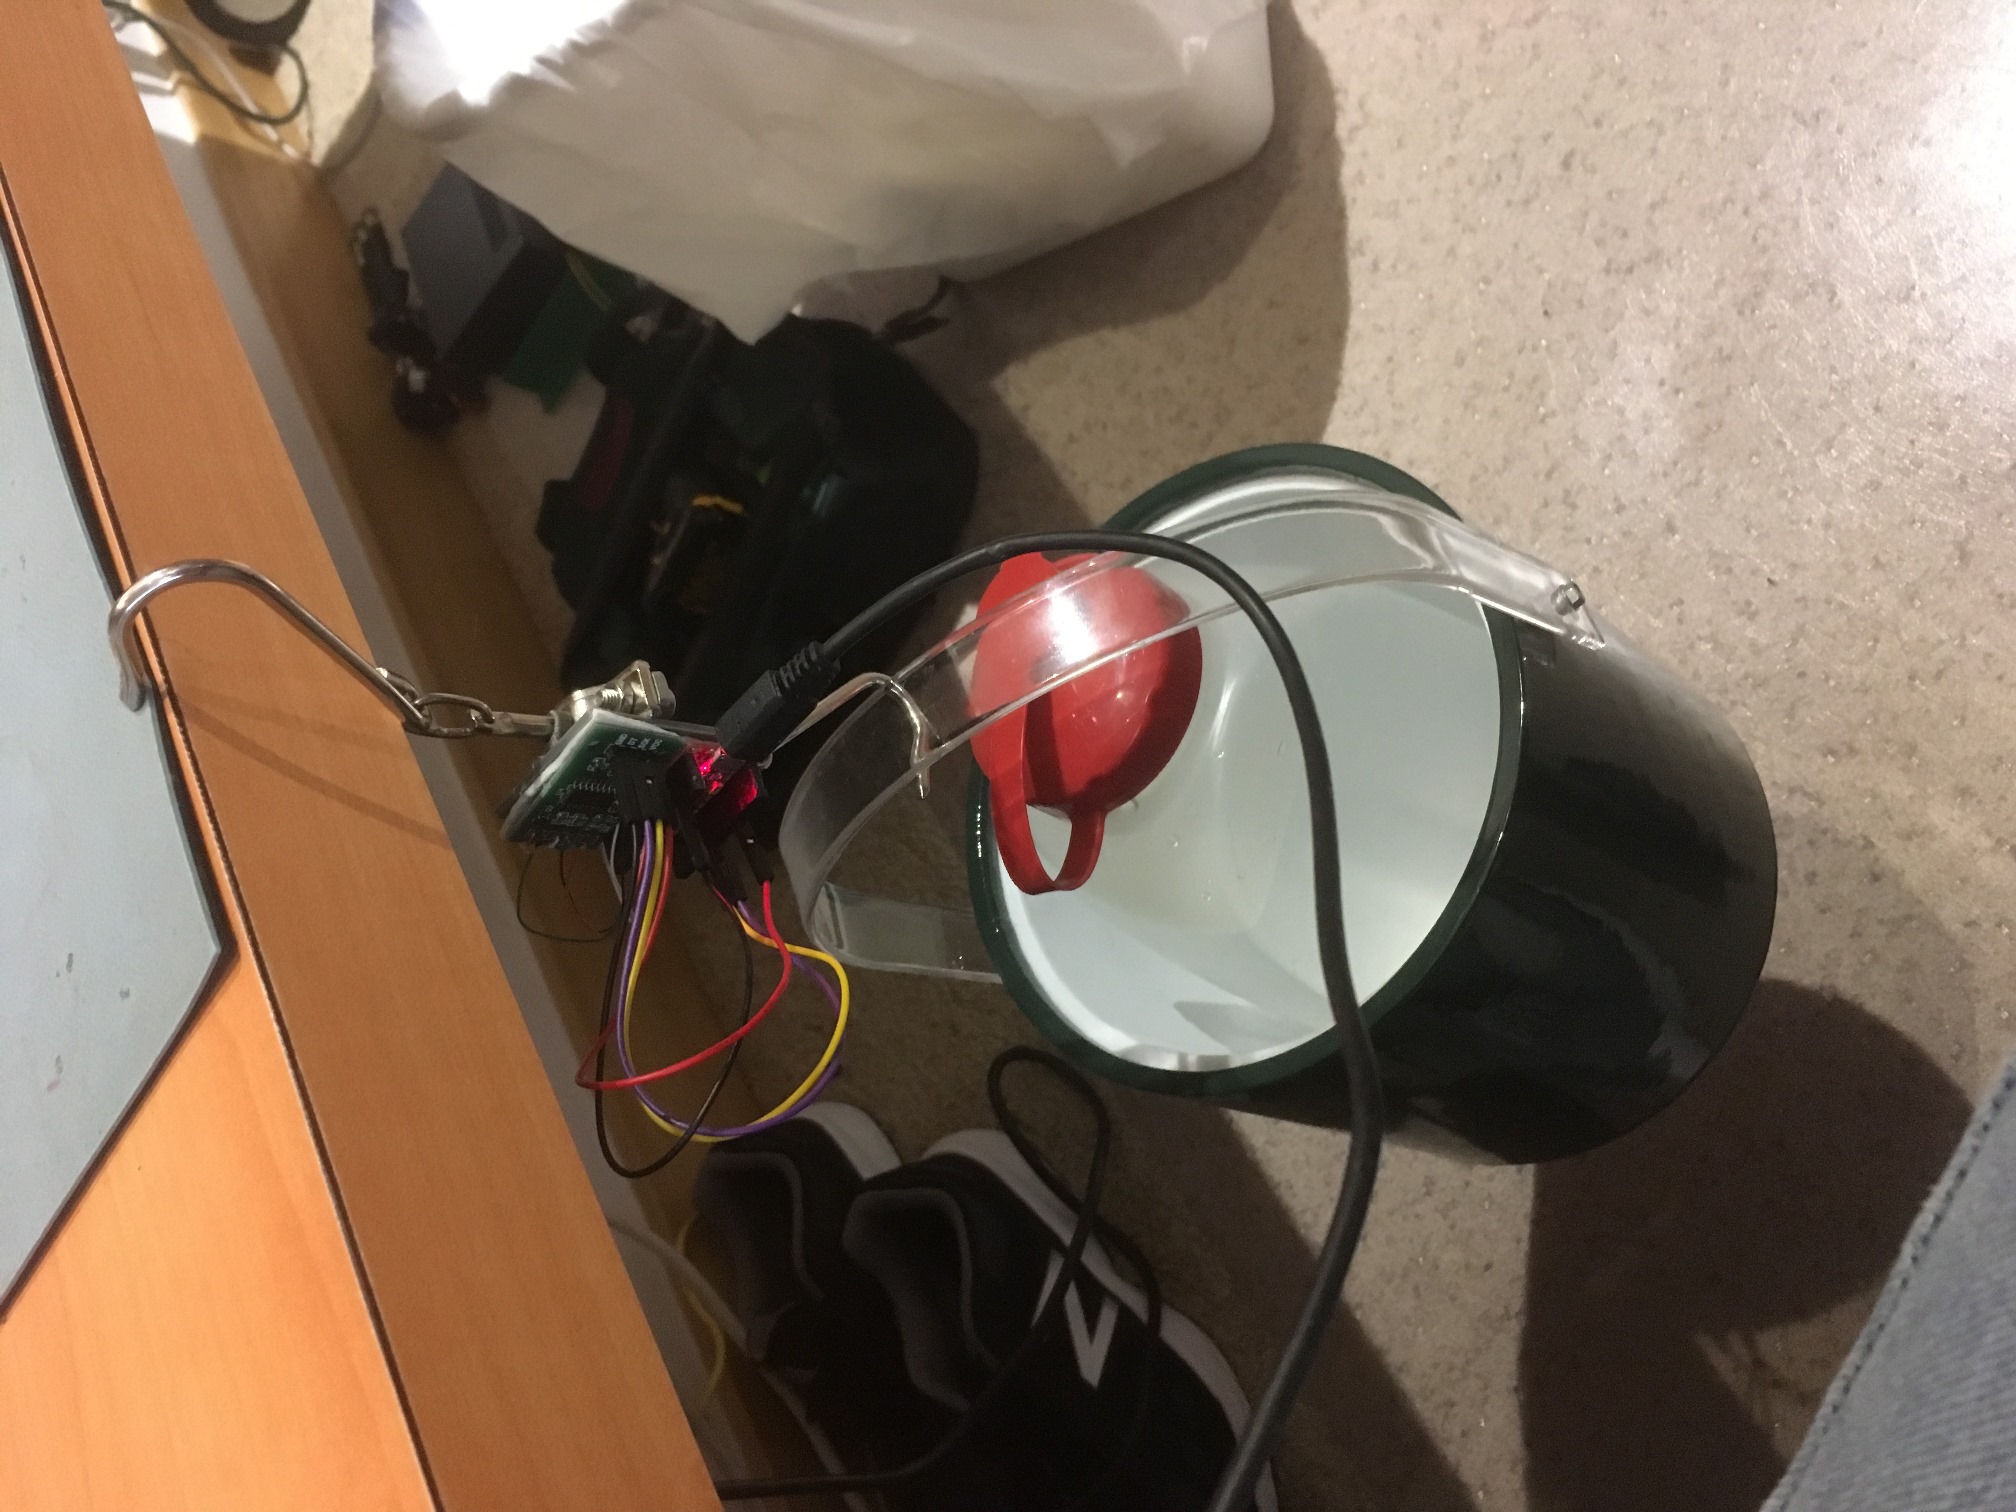
Step2: User establishes 'tare' weight physical configuration with any non-measured weight
attached (in my case, the bucket used to hold measured amounts of water used for
weight calibration), and then presses 'T' to zero out the 'tare weight'
Step3: The user establishes a calibration weight condition (in my case, 1.8 liters of water)
and enters the weight value (in Kg). The program then calculates the scale factor
needed to calibrate the scale for the entered weight and then automatically
drops into measurement mode
Step5: The user enters 'q' to quit measurements.
*/
/*
I need to combine the calibration code from TeensyDigitalScaleCalibration.ino with this
program, so I can run the cal procedure by sending a character or two from my PC or phone.
No character, no calibration.
*/
#pragma region DEBUG_DEFINES
#define NO_SNOOZE
#pragma endregion Debugging Defines
#pragma region CAL_SUPPORT
#include <elapsedMillis.h>
elapsedMillis sinceLastWaitMsg;
const int WAITINGMSGINTERVALMSEC = 1000; //1-sec intervals
const int MAX_WAITING_INTERVALS = 10; //how long to wait before starting measurement
const int BUFLEN = 20;
int numWaitIntervals = 0;
char inbuf[BUFLEN]; //buffer for user input
char inbuf1[BUFLEN];//buffer for serial1 input
//Change this calibration factor as per your load cell once it is found. You many need to vary it in thousands
bool bDoneMeasuring = false;
const char* waitstr = "Waiting...Measurements will start in ";
#pragma endregion Calibration Support
#include <SPI.h>
#include <Adafruit_GFX.h>
#include <Adafruit_PCD8544.h>
#pragma region LOW_POWER_SUPP
//12/03/18 added for low power mode
#include <Snooze.h>
// Load just the 'timer' wake-up driver
SnoozeTimer timer;
SnoozeUSBSerial usb;
SnoozeBlock config_teensy32(usb, timer);
const int SLEEP_TIME_MSEC = 5000;
const float INACTIVE_SCALE_THRESHOLD_KG = 1.f;
//const float INACTIVE_SCALE_THRESHOLD_KG = -10.f;
//const int MIN_INACTIVE_SCALE_COUNT = 100;
const int MIN_INACTIVE_SCALE_COUNT = 20;
const int BLUETOOTH_POWER_PIN = 12;
int numInactiveScaleCounts = 0;
#pragma endregion Low Power Support
#pragma region LOAD_CELL
#include "HX711.h" //You must have this library in your arduino library folder
#include <EEPROM.h>
#include<EEPROMAnything.h> //so I can read the last calibration value from EEPROM
#define DOUT A1
#define CLK A0
HX711 scale(DOUT, CLK);
//Change this calibration factor as per your load cell once it is found. You many need to vary it in thousands
long calibration_factor = -96650; //-106600 worked for my 40Kg max scale setup
long tare_offset = 0;
const int LED_PIN = 13;
const int CAL_FACTOR_EEPROM_ADDR = 0;
const int TARE_OFFSET_EEPROM_ADDR = CAL_FACTOR_EEPROM_ADDR + sizeof(calibration_factor);
float scaleKg = 0;
float vBatt = 0;
#pragma endregion Load Cell Support
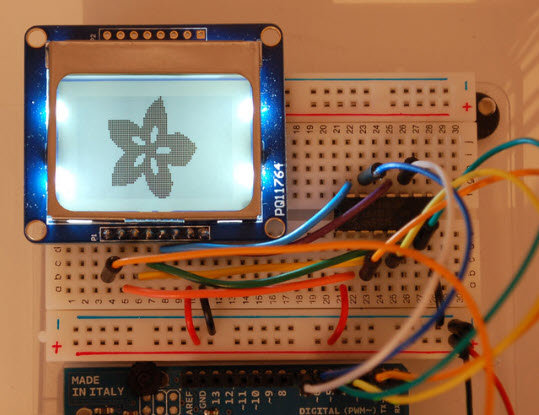
#pragma region LCD_DISPLAY
// Hardware SPI (faster, but must use certain hardware pins):
// Note with hardware SPI MISO and SS pins aren't used but will still be read
// and written to during SPI transfer. Be careful sharing these pins!
// SCK is LCD serial clock (SCLK) - this is pin 13 on Arduino Uno
// MOSI is LCD DIN - this is pin 11 on an Arduino Uno
// pin 6 - Data/Command select (D/C)
// pin 5 - LCD chip select (CS)
// pin 4 - LCD reset (RST)
const int LCD_DC_PIN = 6;
const int LCD_CS_PIN = 5;
const int LCD_RST_PIN = 4;
//const int SPI_DOUT_PIN = 11;
const int SPI_SCK_PIN = A0;
//const int SPI_SCK_PIN = 12;
const int LCD_BACKLIGHT_PIN = 3;
//Adafruit_PCD8544 display = Adafruit_PCD8544(6, 5, 4);//11/25/18
Adafruit_PCD8544 display = Adafruit_PCD8544(LCD_DC_PIN, LCD_CS_PIN, LCD_RST_PIN);//12/16/18 chg to identifiers
#pragma endregion Noki LCD Display
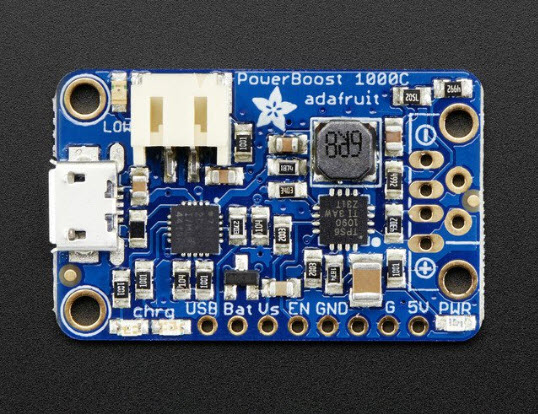
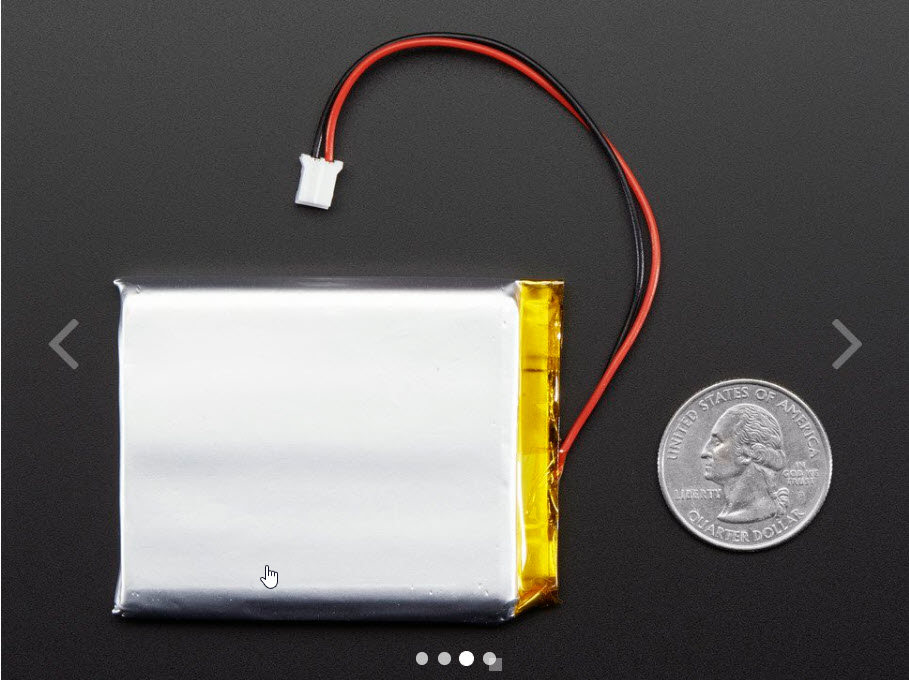
#pragma region BATT_FUEL_GUAGE
const int BATT_SYMBOL_X = 68;
const int BATT_SYMBOL_Y = 1;
const int BATT_SYMBOL_H = 8;
const int BATT_SYMBOL_W = 16;
const int DEFAULT_CHAR_HEIGHT = 8;
const int DEFAULT_CHAR_WIDTH = 5;
const int DEFAULT_CHAR_SIZE = 2;
//added 12/03/18 for battV measurements
//12/06/18 changed to internal 1.2V reference and 30K:10K divider
const int BATTV_READ_PIN = A7;
const int DEAD_BATT_COUNTS = 642;
const int FULL_BATT_COUNTS = 887;
const float FULL_BATT_VOLTS = 4.2;
const float DEAD_BATT_VOLTS = 3.0;
const float VOLTS_PER_COUNT = (FULL_BATT_VOLTS - DEAD_BATT_VOLTS) / (FULL_BATT_COUNTS - DEAD_BATT_COUNTS);
#pragma endregion Battery Fuel Guage
void setup()
{
Serial.begin(115200);
delay(1000); //need this to get serial printout
Serial.println("Welcome to the Teensy Low Power Digital Scale Program");
Serial1.begin(9600);
Serial1.println("Welcome via Bluetooth!");
//initialize load cell and retrieve cal/tar values from EEPROM
EEPROM_readAnything(CAL_FACTOR_EEPROM_ADDR, calibration_factor); //read current cal scale from EEPROM
Serial.printf("The current stored scale calibration factor is %li\n", calibration_factor);
scale.set_scale(calibration_factor);
EEPROM_readAnything(TARE_OFFSET_EEPROM_ADDR, tare_offset); //read current tare offset from EEPROM
Serial.printf("The current stored tare offset factor is %li\n", tare_offset);
scale.set_offset(tare_offset);
if (IsCalibrationRequired(5)) //number of time intervals to wait
{
if (DoCalibration(10, 20)) //01/03/19 added numwait params to sig
{
Serial.printf("Calibration completed successfully... Starting Measurements\n\n");
Serial1.printf("Calibration completed successfully... Starting Measurements\n\n");
}
else
{
Serial.printf("Calibration Failed - Measurements may be invalid!\n\n");
Serial1.printf("Calibration Failed - Measurements may be invalid!\n\n");
}
Serial.printf("Time(mSec)\tWt(Kg)\n");
}
/********************************************************
Set Low Power Timer wake up in milliseconds.
********************************************************/
timer.setTimer(SLEEP_TIME_MSEC);// milliseconds
//12/04/18 added code to set analog reference to internal 1.2V source
analogReference(INTERNAL1V1);
//initialize LCD display
display.begin();
display.setContrast(60); //pretty dark
display.setTextSize(1);
display.setTextColor(BLACK);
display.setCursor(0, 0);
display.display(); //first time - shows the Adafruit logo
delay(1000); //show Adafruit logo for 1 sec
display.clearDisplay(); // clears the screen and buffer
display.display(); //first time - shows the Adafruit logo
display.setCursor(0, 0);
display.println("Hello LCD!");
display.display();
pinMode(BLUETOOTH_POWER_PIN, OUTPUT);
digitalWrite(BLUETOOTH_POWER_PIN, HIGH); //enable the bluetooth module
//01/09/19 make sure the backlight LED is OFF
pinMode(LCD_BACKLIGHT_PIN, OUTPUT);
digitalWrite(LCD_BACKLIGHT_PIN, LOW);
}
void loop()
{
//12/06/18 now using 30K/10K voltage divider on A7 and 1.2V ref.
display.clearDisplay(); //clear memory bitmap
display.setCursor(0, 0);
vBatt = UpdateBatteryDisplay();
//scaleKg = UpdateScaleDisplay();
scaleKg = scale.get_units(3);
Serial1.printf("%5.3f\r\n", scaleKg); //to BT module
Serial.printf("%5.3f\n", scaleKg); //to serial console
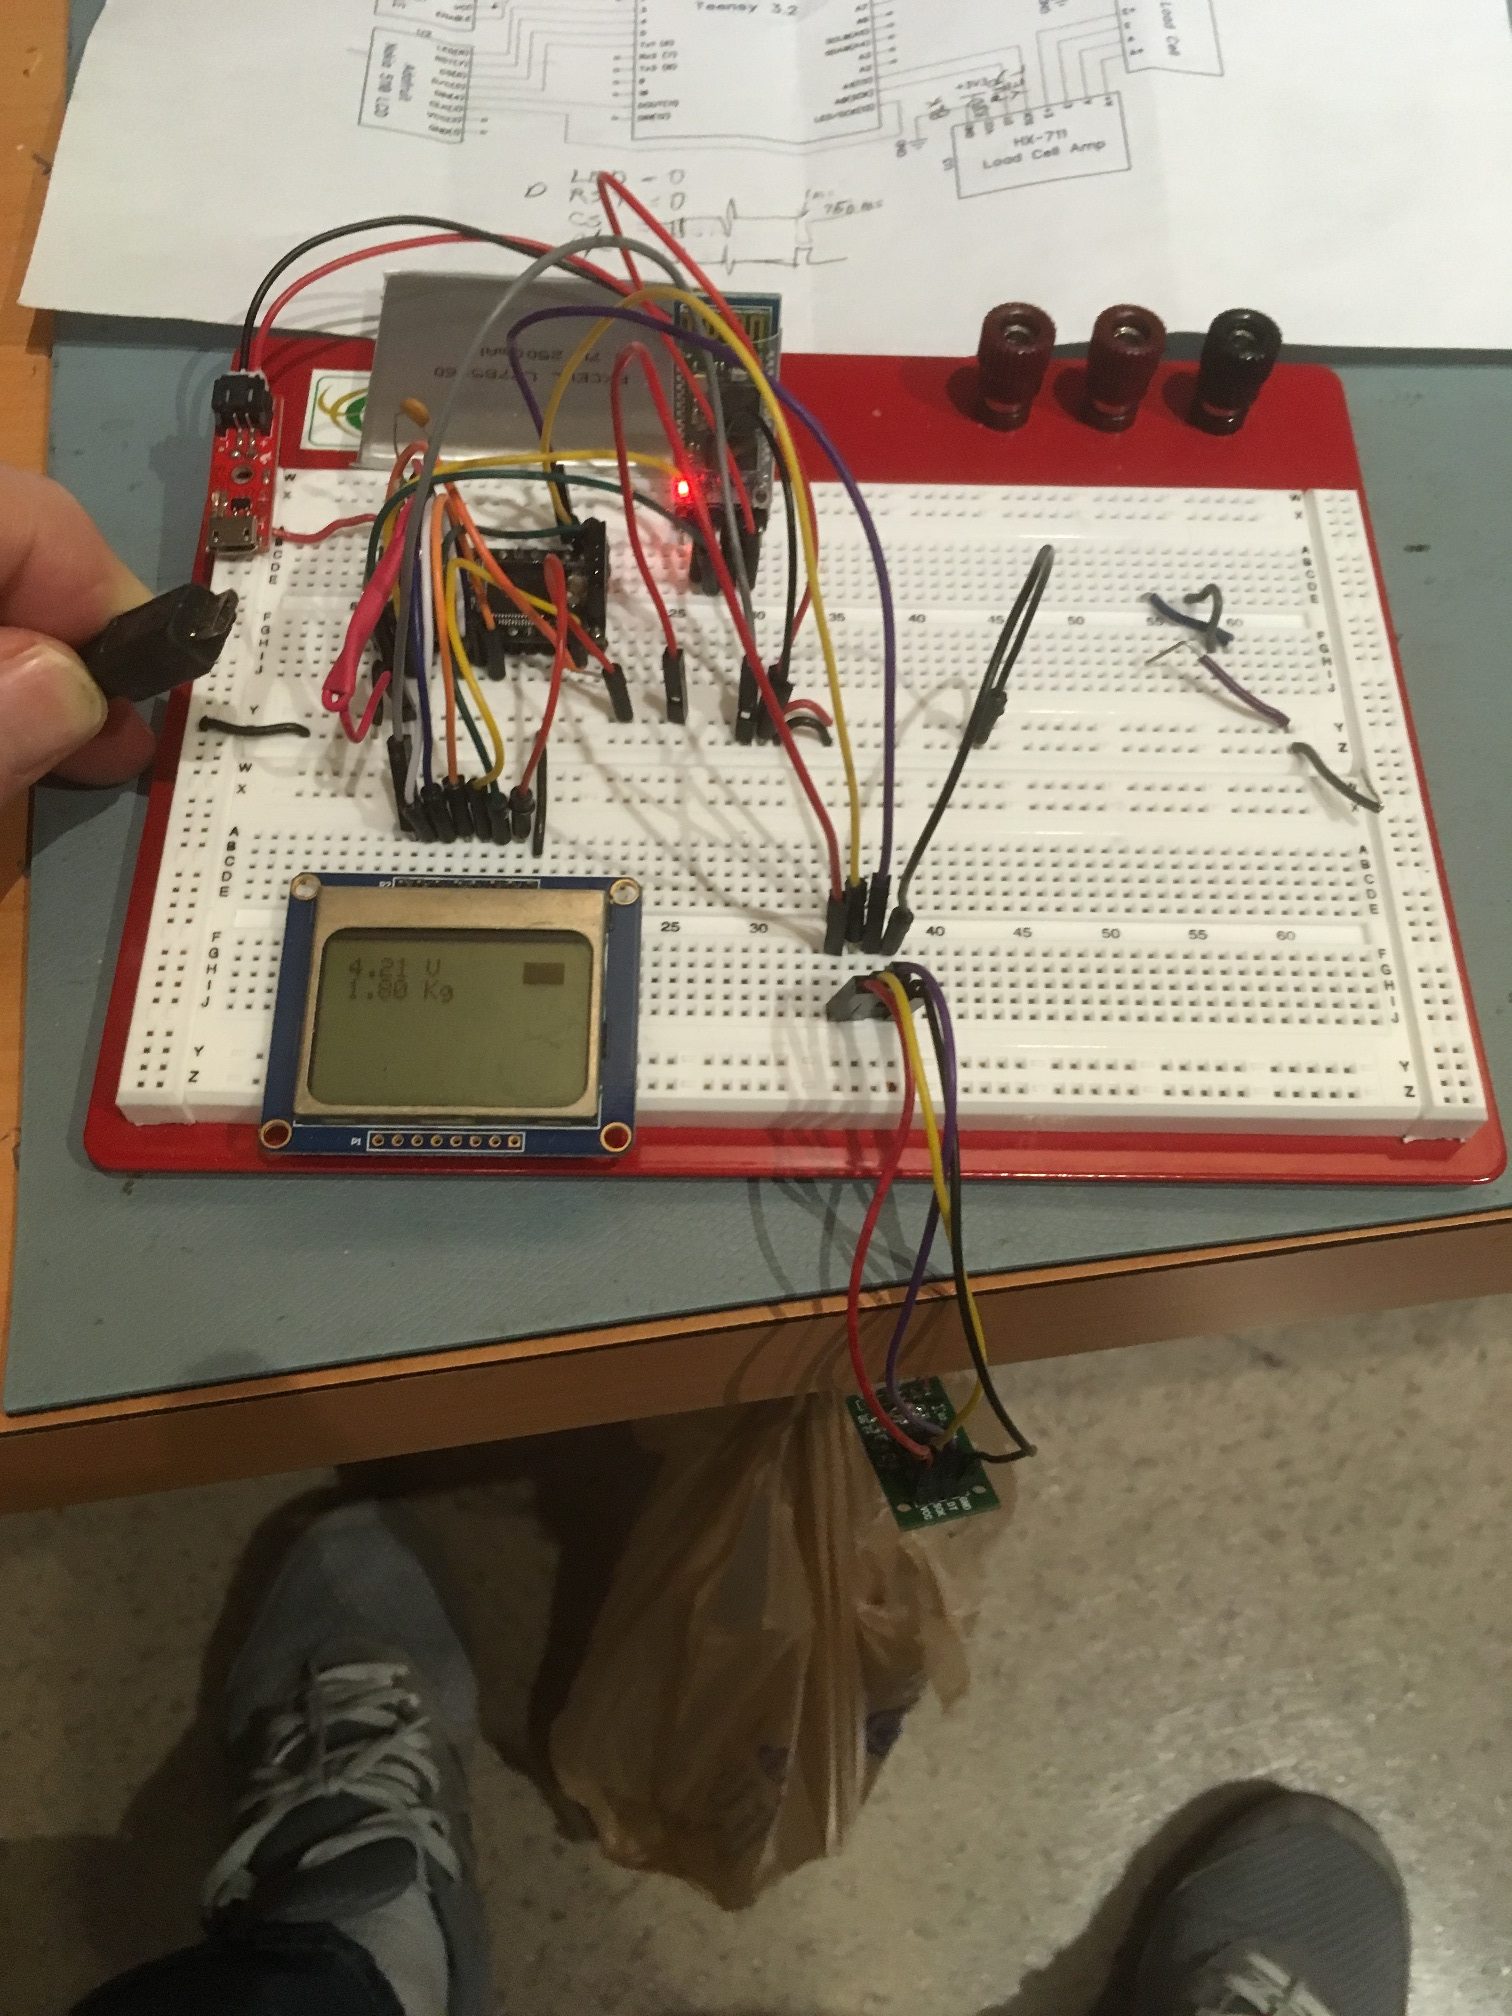
display.print(scaleKg); display.println(" Kg");//to LCD display
display.display();
#ifndef NO_SNOOZE
//if the scale has been quiet for a while, go to sleep
if (scaleKg <= INACTIVE_SCALE_THRESHOLD_KG)
{
numInactiveScaleCounts++;
if (numInactiveScaleCounts >= MIN_INACTIVE_SCALE_COUNT)
{
numInactiveScaleCounts = MIN_INACTIVE_SCALE_COUNT;
}
}
else
{
numInactiveScaleCounts = 0; //one active measurment wakes everything up
}
if (numInactiveScaleCounts >= MIN_INACTIVE_SCALE_COUNT)
{
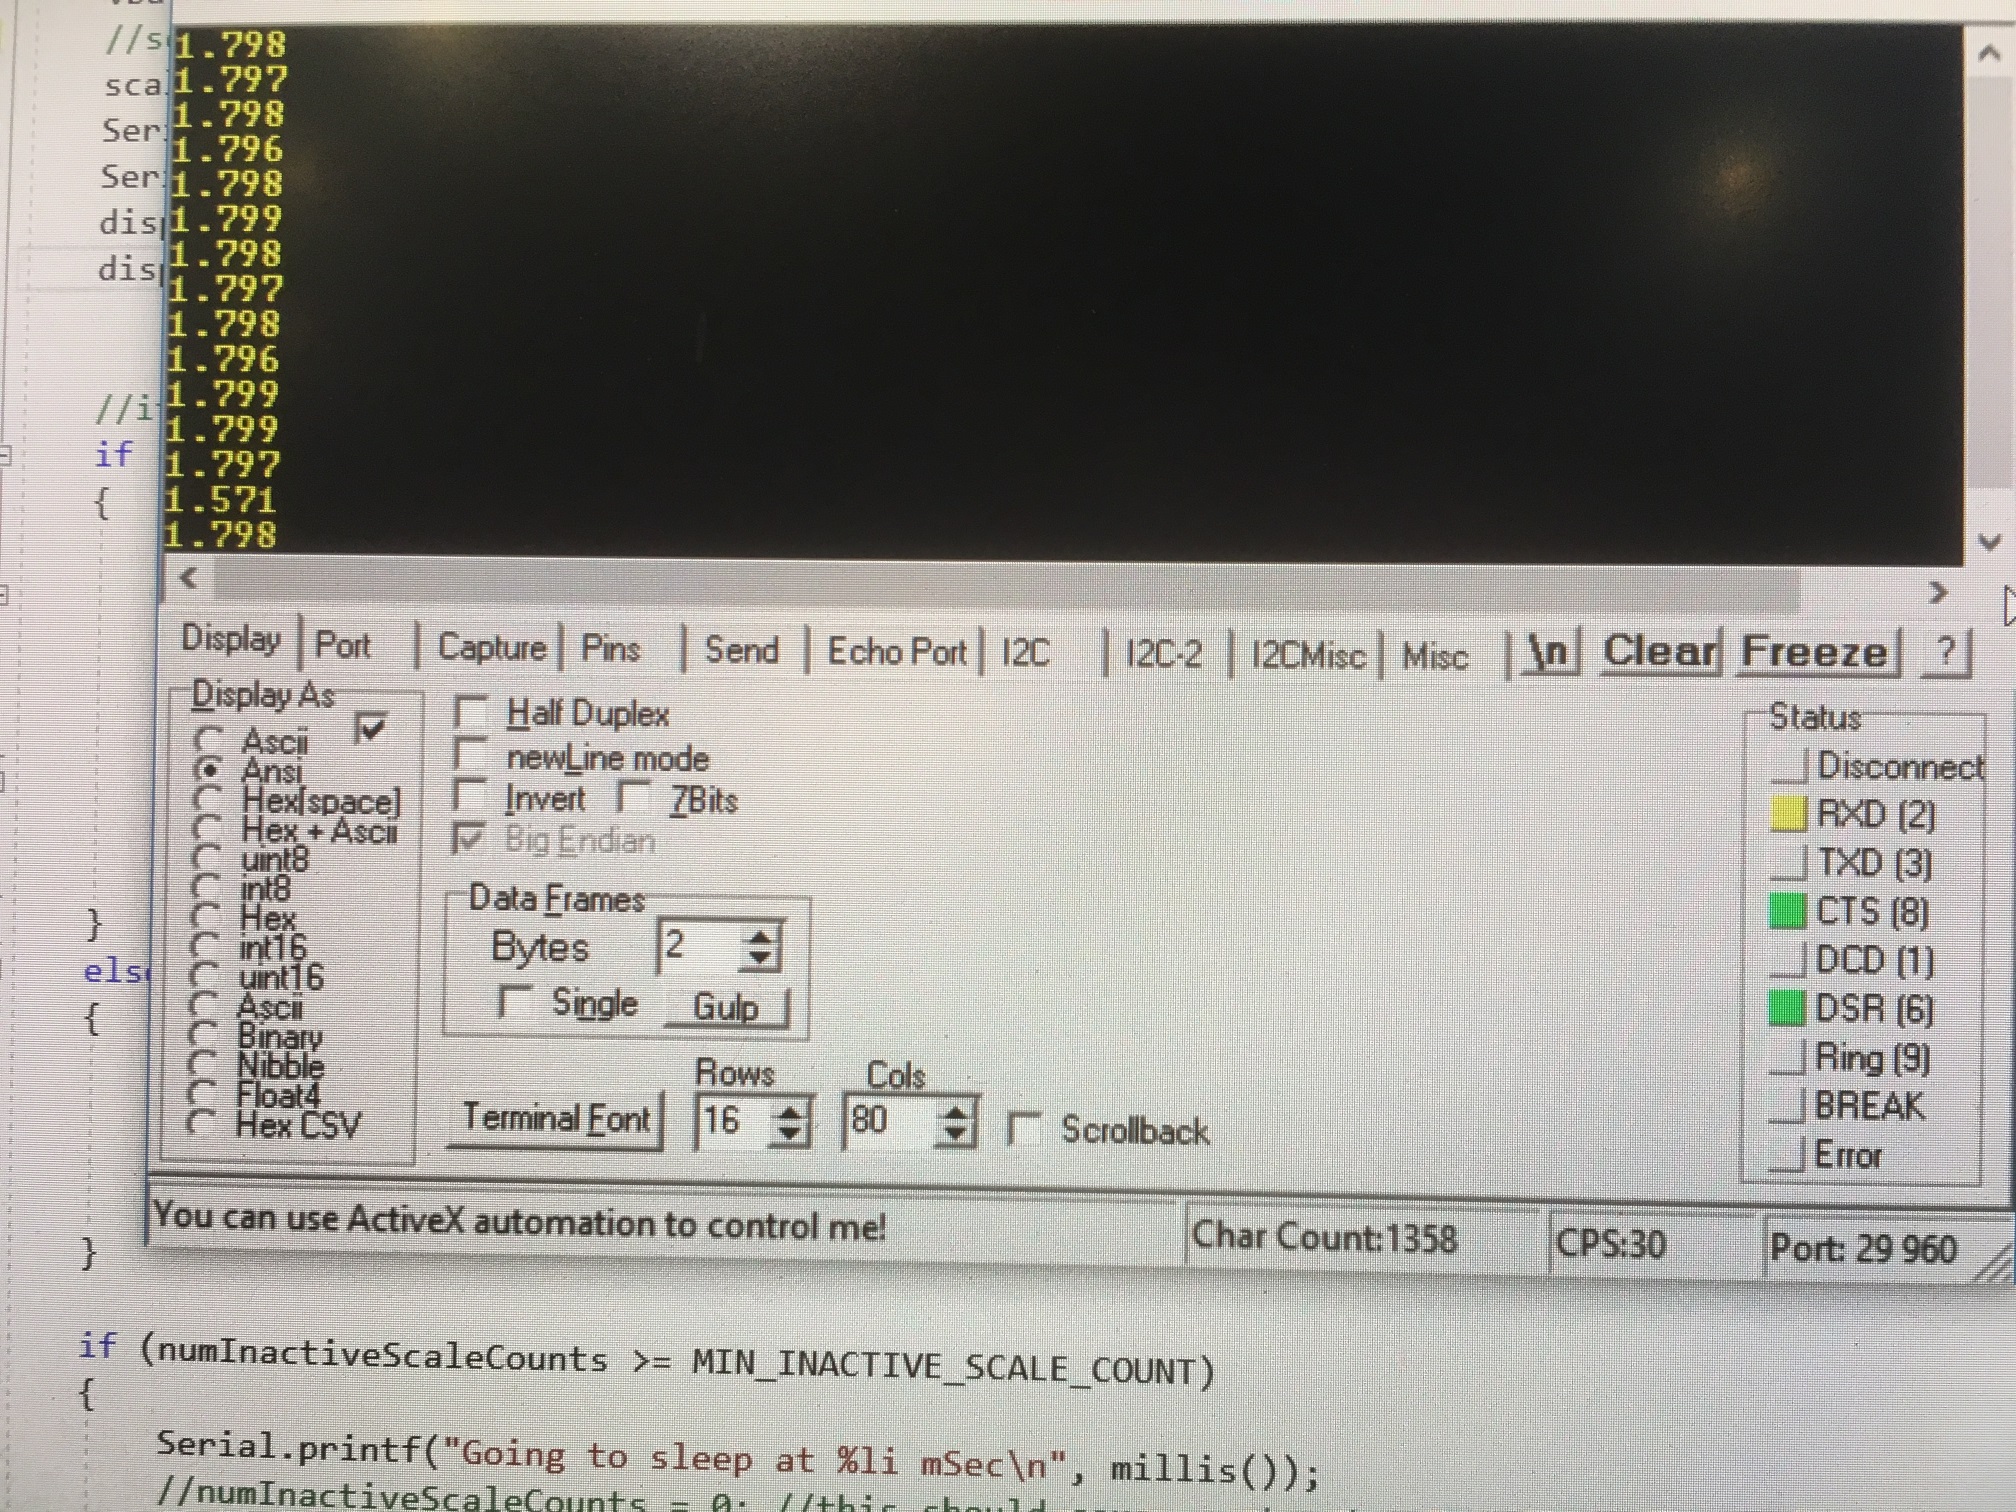
Serial.printf("Going to sleep at %li mSec\n", millis());
delay(1000); //needed to get the print out the door before sleeping
//01/04/18 added to disable bluetooth module while sleeping
digitalWrite(BLUETOOTH_POWER_PIN, LOW);
display.clearDisplay();
display.display();
Snooze.sleep(config_teensy32); //sleep
}
#endif // !NO_SNOOZE
if (digitalRead(BLUETOOTH_POWER_PIN) == LOW)
{
digitalWrite(BLUETOOTH_POWER_PIN, HIGH); //re-enable the BT module
}
delay(100);
}
float UpdateScaleDisplay()
{
float kG = scale.get_units(3);
//float kG = (float)random(0,40);
display.print(kG); display.println(" Kg");
return kG;
}
float UpdateBatteryDisplay()
{
int batt_counts = analogRead(BATTV_READ_PIN);
float batt_volts = DEAD_BATT_VOLTS + (batt_counts - DEAD_BATT_COUNTS) * VOLTS_PER_COUNT;
display.print(batt_volts); display.println(" V");
UpdateBatterySymbol(batt_volts);
return batt_volts;
}
void UpdateBatterySymbol(float vbatt)
{
//Purpose: Update the battery symbol to show current charge state
//Inputs:
// vbatt = current battery voltage
// FULL_BATT_VOLTS = fully charged battery voltage
// DEAD_BATT_VOLTS = fully discharged battery voltage
// BATT_SYMBOL_X/Y/H/W = battery symbol loc/dims
//Outputs: Updated battery symbol
//Plan:
// Step1: draw open rect for battery symbol outline
// Step2: draw filled rect indicating charge state
// Step3: If vbatt <= DEAD_BATT_VOLTS, draw 'X' over symbol
//Step1: draw open rect for battery symbol outline
display.drawRect(BATT_SYMBOL_X, BATT_SYMBOL_Y, BATT_SYMBOL_W, BATT_SYMBOL_H, 1);
//Step2: draw filled rect indicating charge state
float Vrange = FULL_BATT_VOLTS - DEAD_BATT_VOLTS;
int fillWidth = (int)(BATT_SYMBOL_W * ((vbatt - DEAD_BATT_VOLTS) / Vrange) + 0.5f);
//Serial.printf("vbat, fillW = %4.2f,%d\n", vbatt, fillWidth);
display.fillRect(BATT_SYMBOL_X, BATT_SYMBOL_Y, fillWidth, BATT_SYMBOL_H, 1);
//Step3: If vbatt <= DEAD_BATT_VOLTS, draw 'X' over symbol
if (vbatt <= DEAD_BATT_VOLTS)
{
//try drawing lines from corner to corner
int ulX = BATT_SYMBOL_X;
int ulY = BATT_SYMBOL_Y;
int urX = BATT_SYMBOL_X + BATT_SYMBOL_W;
int urY = ulY;
int lrX = urX;
int lrY = urY + BATT_SYMBOL_H;
int llX = ulX;
int llY = lrY;
display.drawLine(ulX, ulY, lrX, lrY, 1);
display.drawLine(llX, llY, urX, urY, 1);
}
}
bool IsCalibrationRequired(int numWaitIntervals)
{
//Purpose: Determine if the user wishes to run the cal procedure
//Inputs: Serial and Serial1 (Serial is the normal PC serial port, Serial1 is Bluetooth
//Outputs: returns TRUE if a 'y/Y' is received from either serial port within a
// few seconds of power-up.
//Plan:
// Step1: Send the 'do you wish to calibrate' message to both ports
// Step2: Watch for activity until timeout expires. If nothing received,
// return FALSE. If a 'y' or 'Y' is received, return TRUE
bool result = false;
//Step1: Send the 'do you wish to calibrate' message to both ports
//normal PC serial monitor port
Serial.printf("Enter 'Y' to start the calibration, any other key to skip\n");
Serial.printf("Calibrate (Y/N) (N)?\n");
//Bluetooth serial port
Serial1.printf("Enter 'Y' to start the calibration, any other key to skip\r\n");
Serial1.printf("Calibrate (Y/N) (N)?\r\n");
//Step2: Watch for activity until timeout expires. If nothing received,
// return FALSE. If a 'y' or 'Y' is received, return TRUE
int intervalCount = 0;
sinceLastWaitMsg = 0;
memset(inbuf, 0, BUFLEN);
memset(inbuf1, 0, BUFLEN);
Serial.printf("inbuf = %s, inbuf1 = %s\n", inbuf, inbuf1);
while (!GetUserInputStr0(inbuf) && !GetUserInputStr1(inbuf1)
&& intervalCount < numWaitIntervals) //returns true if strlen(inbuf) > 0
{
if (sinceLastWaitMsg >= WAITINGMSGINTERVALMSEC)
{
sinceLastWaitMsg -= WAITINGMSGINTERVALMSEC;
intervalCount++;
Serial.printf("%s %d\n", waitstr, numWaitIntervals - intervalCount);
Serial1.printf("%s %d\r\n", waitstr, numWaitIntervals - intervalCount); //bluetooth
}
delay(250);
}
Serial.printf("Received %s from Serial, %s from Serial1\n", inbuf, inbuf1);
if (strncasecmp("Y", inbuf, 1) == 0 || strncasecmp("Y",inbuf1,1) == 0) //compare only 1st chars, as user input may have CR/LF appended
{
result = true;
}
return result;
}
bool GetUserInputStr0(char* inbuf)
{
//Purpose: Get user input from Serial0
//Inputs:
// inbuf = pointer to char[10] array to receive user input
//Outputs:
// inbuf = String object containing user input.
// returns True if user input was received, False if the routine timed out
//Plan:
// Wait for user input or timeout whichever occurs first
//Notes:
// 12/27/18 modified to work with both Serial & Serial1 ports. We assume that
// userinput is coming from one port or the other, but not both
// 01/02/19 re-written for cleaner code
//Serial1.printf("In GetUserInputStr0\n");
memset(inbuf, 0, BUFLEN);
int readbyte = 0;
int charidx = 0;
while (Serial.available() && charidx < 100)
{
readbyte = Serial.read();
inbuf[charidx] = readbyte;
charidx++;
}
if (strlen(inbuf) > 0)
{
Serial.print("Received "); Serial.print(inbuf); Serial.println(" from Serial0");
}
return (charidx < 100 && strlen(inbuf) > 0);
}
bool GetUserInputStr1(char* inbuf1)
{
//Purpose: Get user input from Serial1
//Inputs:
// inbuf1 = pointer to char[10] array to receive user input from Serial1
//Outputs:
// inbuf1 = String object containing user input from Serial1.
// returns True if user input was received, False if the routine timed out
//Plan:
// Wait for user input or timeout whichever occurs first
//Notes:
// 12/30/18 coped from GetUserInput & modified to work with Serial1 ports
// 01/02/19 re-written for cleaner code
//Serial1.printf("In GetUserInputStr1\n");
memset(inbuf1, 0, BUFLEN);
int readbyte = 0;
int charidx = 0;
while (Serial1.available() && charidx < 100)
{
readbyte = Serial1.read();
inbuf1[charidx] = readbyte;
charidx++;
}
if (strlen(inbuf1) > 0)
{
Serial1.print("Received "); Serial1.print(inbuf1); Serial1.println(" from Serial1");
}
return (charidx < 100 && strlen(inbuf1) > 0);
}
bool DoCalibration(int numwait_tare, int numwait_weight)
{
Serial.printf("Digital Scale Program\n");
Serial.printf("Program to automatically calibrate HX711/Load Cell to measure weight in Kg\n");
EEPROM_readAnything(CAL_FACTOR_EEPROM_ADDR, calibration_factor); //read current cal scale from EEPROM
Serial.printf("The current stored scale calibration factor is %li\n", calibration_factor);
if (isnan((float)calibration_factor))
{
Serial.printf("invalid cal factor: Setting to -96650\n");
calibration_factor = -96650;
}
scale.set_scale(calibration_factor);
EEPROM_readAnything(TARE_OFFSET_EEPROM_ADDR, tare_offset); //read current tare offset from EEPROM
Serial.printf("The current stored tare offset factor is %li\n", tare_offset);
if (isnan((float)tare_offset))
{
Serial.printf("invalid cal factor: Setting to zero\n");
tare_offset = 0;
}
scale.set_offset(tare_offset);
//calibrate with known weights
Serial.println("HX711 Calibration");
Serial.println("Remove all non-fixture weight from scale, and press 't' to zero the scale");
Serial.println("Or any other character to skip this step");
Serial1.println("HX711 Calibration");
Serial1.println("Remove all non-fixture weight from scale, and press 't' to zero the scale");
Serial1.println("Or any other character to skip this step");
memset(inbuf, 0, BUFLEN);
memset(inbuf1, 0, BUFLEN);
int intervalCount = 0;
sinceLastWaitMsg = 0;
while (!GetUserInputStr0(inbuf) && !GetUserInputStr1(inbuf1)
&& intervalCount < numwait_tare) //returns true if strlen(inbuf) > 0
{
if (sinceLastWaitMsg >= WAITINGMSGINTERVALMSEC)
{
sinceLastWaitMsg -= WAITINGMSGINTERVALMSEC;
intervalCount++;
Serial.printf("%s %d\n", waitstr, numwait_tare - intervalCount);
Serial1.printf("%s %d\r\n", waitstr, numwait_tare - intervalCount); //bluetooth
}
delay(250);
}
if (strncasecmp("T", inbuf, 1) == 0 || strncasecmp("T", inbuf1,1) == 0) //compare only 1st chars, as user input may have CR/LF appended
{
tare_offset = scale.read_average(); //Get a baseline reading
Serial.printf("Applying offset %li as tare adjustment\n", tare_offset);
scale.set_offset(tare_offset); //this value will be subtracted from all future measurements
Serial.printf("Writing offset %li to EEPROM address %d\n", tare_offset, TARE_OFFSET_EEPROM_ADDR);
EEPROM_writeAnything(TARE_OFFSET_EEPROM_ADDR, tare_offset);
EEPROM_readAnything(TARE_OFFSET_EEPROM_ADDR, tare_offset);
Serial.printf("Read offset %li from EEPROM address %d\n", tare_offset, TARE_OFFSET_EEPROM_ADDR);
}
Serial.println("Apply a known weight (the higher the better) and enter its value in Kg");
Serial.println("Enter 0 to skip this step");
Serial1.println("Apply a known weight (the higher the better) and enter its value in Kg");
Serial1.println("Enter 0 to skip this step");
memset(inbuf, 0, BUFLEN);
memset(inbuf1, 0, BUFLEN);
intervalCount = 0;
sinceLastWaitMsg = 0;
while (!GetUserInputStr0(inbuf) && !GetUserInputStr1(inbuf1)
&& intervalCount < numwait_weight) //returns true if strlen(inbuf) > 0
{
if (sinceLastWaitMsg >= WAITINGMSGINTERVALMSEC)
{
sinceLastWaitMsg -= WAITINGMSGINTERVALMSEC;
intervalCount++;
Serial.printf("%s %d\n", waitstr, numwait_weight - intervalCount);
Serial1.printf("%s %d\r\n", waitstr, numwait_weight - intervalCount); //bluetooth
}
delay(250);
}
//calculate scale factor resulting in user-input wt
//wt(Kg) = (read_avg - OFFSET)/Scale
//Scale = (read_avg - OFFSET)/wt(Kg)
double wtKg = 0;
if (strlen(inbuf) > 0)
{
wtKg = atof(inbuf);
Serial.printf("User weight input was %4.2f\n", wtKg);
}
else if(strlen(inbuf1) > 0)
{
wtKg = atof(inbuf1);
Serial1.printf("User weight input was %4.2f\r\n", wtKg);
}
else
{
Serial.printf("No user input detected - using 0.00Kg\n");
Serial1.printf("No user input detected - using 0.00Kg\r\n");
}
long read_avg = scale.read_average();
long offset = scale.get_offset();
calibration_factor = (double)(read_avg - offset) / wtKg;
scale.set_scale(calibration_factor); //Adjust to this calibration factor
Serial.printf("User weight input was %4.2f, read_avg = %li, offset = %li, cal = ",
wtKg, read_avg, offset);
Serial.println(calibration_factor); //PrintEx won't print the cal factor value
Serial1.printf("User weight input was %4.2f, read_avg = %li, offset = %li, cal = ",
wtKg, read_avg, offset);
Serial1.println(calibration_factor); //PrintEx won't print the cal factor value
EEPROM_writeAnything(CAL_FACTOR_EEPROM_ADDR, calibration_factor);
Serial.print("Wrote cal factor "); Serial.print(calibration_factor); //Serial.printf doesn't work for cal factor
Serial.printf(" to EEPROM address %d\n", CAL_FACTOR_EEPROM_ADDR);
Serial1.print("Wrote cal factor "); Serial1.print(calibration_factor); //Serial.printf doesn't work for cal factor
Serial1.printf(" to EEPROM address %d\r\n", CAL_FACTOR_EEPROM_ADDR);
EEPROM_readAnything(CAL_FACTOR_EEPROM_ADDR, calibration_factor);
Serial.print("Read cal factor "); Serial.print(calibration_factor); //Serial.printf doesn't work for cal factor
Serial.printf(" from EEPROM address %d\n", CAL_FACTOR_EEPROM_ADDR);
Serial1.print("Read cal factor "); Serial1.print(calibration_factor); //Serial.printf doesn't work for cal factor
Serial1.printf(" from EEPROM address %d\r\n", CAL_FACTOR_EEPROM_ADDR);
Serial.printf("\n\nCalibration Complete\n");
Serial1.printf("\n\nCalibration Complete\r\n");
return true;
}